Text copyright 2011, 2022 by Marcus Chown
Space picture caption text 2011 Planetary Visions Limited
Original electronic edition for iPad 2011 Touch Press LLP
Published by Touch Press and Faber & Faber
All space imagery provided by Planetary Visions Limited
www.planetaryvisions.com
Planet and moon globes, maps, and orbit maps copyright 2011 Planetary Visions Limited
Planet cross-sections by Joe Zeff Design
Jacket copyright 2022 by Hachette Book Group, Inc.
Hachette Book Group supports the right to free expression and the value of copyright. The purpose of copyright is to encourage writers and artists to produce the creative works that enrich our culture.
The scanning, uploading, and distribution of this book without permission is a theft of the authors intellectual property. If you would like permission to use material from the book (other than for review purposes), please contact permissions@hbgusa.com. Thank you for your support of the authors rights.
Black Dog & Leventhal Publishers
Hachette Book Group
1290 Avenue of the Americas
New York, NY 10104
www.hachettebookgroup.com
www.blackdogandleventhal.com
First Edition: October 2011
First Updated Edition: May 2022
Black Dog & Leventhal Publishers is an imprint of Perseus Books, LLC, a subsidiary of Hachette Book Group, Inc. The Black Dog & Leventhal Publishers name and logo are trademarks of Hachette Book Group, Inc.
The publisher is not responsible for websites (or their content) that are not owned by the publisher.
The Hachette Speakers Bureau provides a wide range of authors for speaking events. To find out more, go to www.HachetteSpeakersBureau.com or call (866) 376-6591.
Jacket and interior design by Matthew Riley Cokeley
LCCN: 2021942289
ISBNs: 978-0-7624-8073-9 (hardcover), 978-0-7624-8074-6 (ebook)
E3-20220323-JV-NF-ORI
MOST OF THE PICTURES in this book have been taken by space probes sent out to explore our neighboring planets over the last forty years. Individual pictures, selected from the many thousands that are available, range in scale from whole-disk images taken by ground-based or space telescopes, to microscopic views of rock structure from rover onboard cameras. As well as visible-light images, the full spectrum is shown from x-rays, through ultraviolet and infrared to radio emissions, reflecting the range of sensors used to probe planetary surfaces, atmospheres and magnetic fields.
The planet and moon maps are compiled from many images, sometimes many hundreds, taken by spacecraft as they orbited a planet, or simply flew past it. Each image is geometrically adjusted to show part of the planets surface and then blended with others, correcting for illumination variation, to build up the global map.
The inner planets have each been visited by multiple space probes: Mariner 10 and MESSENGER (Mercury Surface, Space Environment, Geochemistry, and Ranging) to Mercury; Venera, Magellan, and Venus Express to Venus; a whole fleet of satellites and landers to Mars.
Multiple missions have also made it to the large outer planets: Galileo orbited Jupiter; Cassini is still orbiting Saturn, having dropped a lander onto its moon Titan; before that the Voyager mission flew spacecraft past all four gas giants, with Voyager 2 being the only spacecraft to have visited Uranus and Neptune.
Today the New Horizons spacecraft is on its way to Pluto and the Kuiper Belt. Robot probes have even visited asteroids and brought back rock samples, chased comets and returned their dust.
Some planets are better mapped than the Earth, where more than 70 percent of the solid surface is hidden by deep water. Other bodies are only partly covered by images due to the fleeting nature of a flyby encounter. There you will see blank areas on the mapsnot quite Here be Dragons, but definitely terra incognita. The most distant objects, including newly discovered dwarf planets, are no more than a few pixels across in images from the worlds most powerful telescopestantalizing glimpses of new lands yet to be explored.
SOLAR SYSTEM MAPS
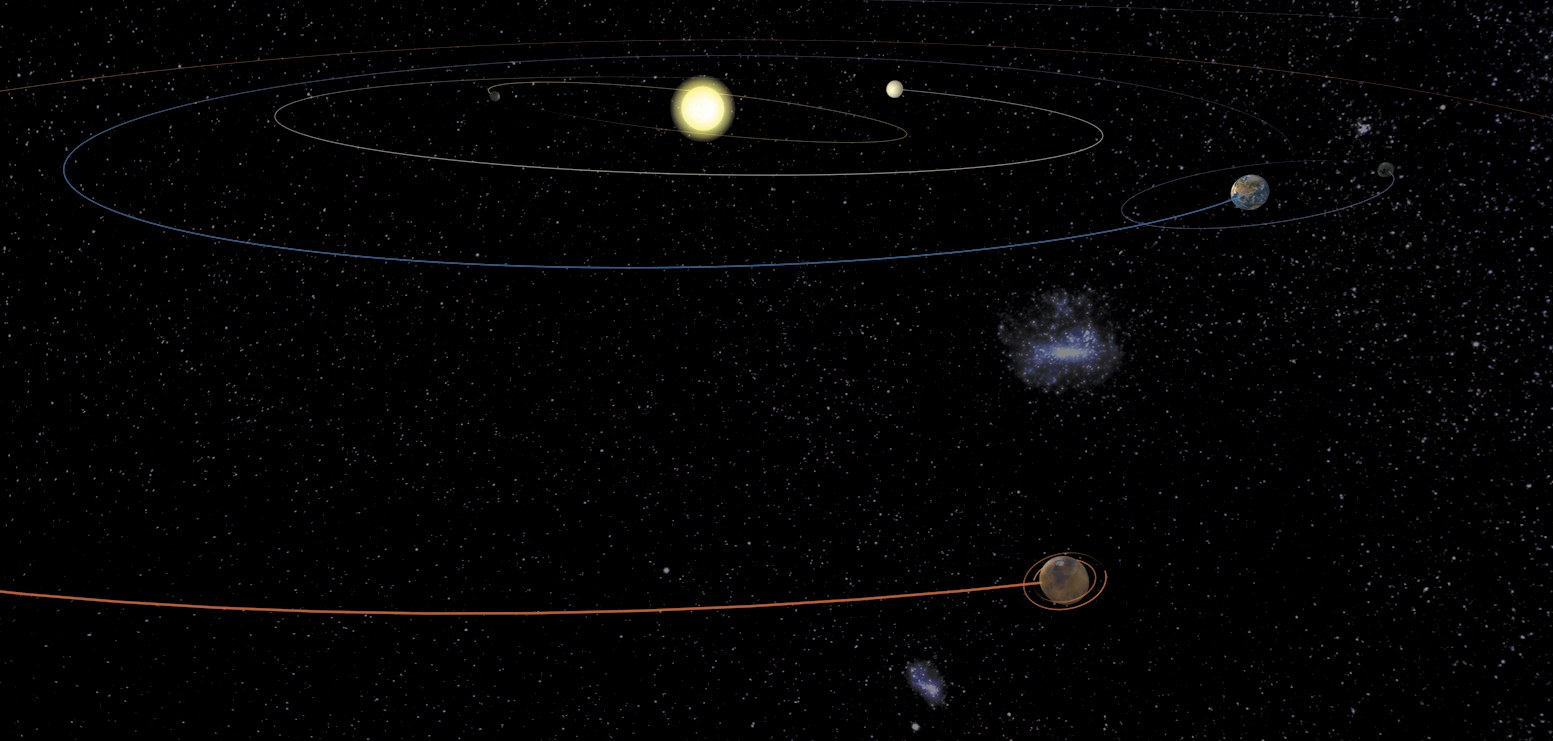
The double-page 3-D maps of the Solar System are accurate computer graphic simulations with planet orbits plotted to true scale. For clarity, the size of the planets and moons in most of the maps has been exaggerated by 500 times, and moon orbits are shown at 50 times their correct size. The position of each body is correct for January 1, 2011. The stars shown in the background are accurate too, drawn from a photographic all-sky survey, with features such as the Milky Way and the Magellanic Clouds appearing in several of the views.
PLANET AND MOON GLOBES
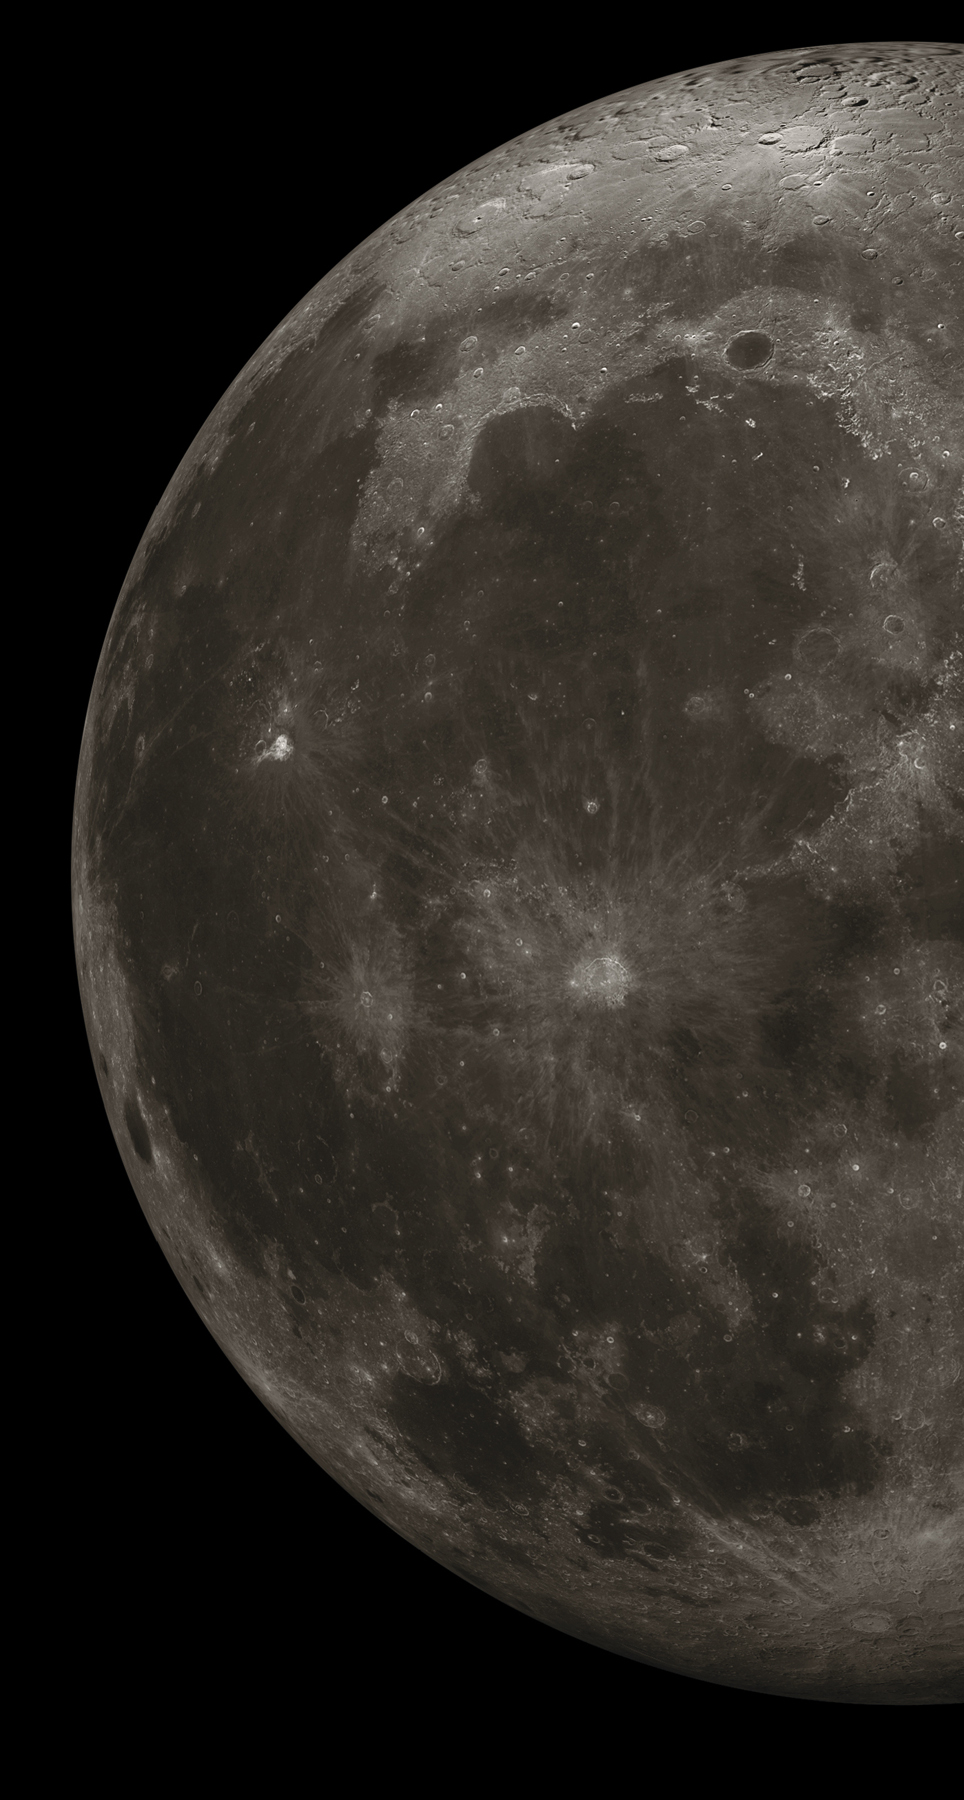
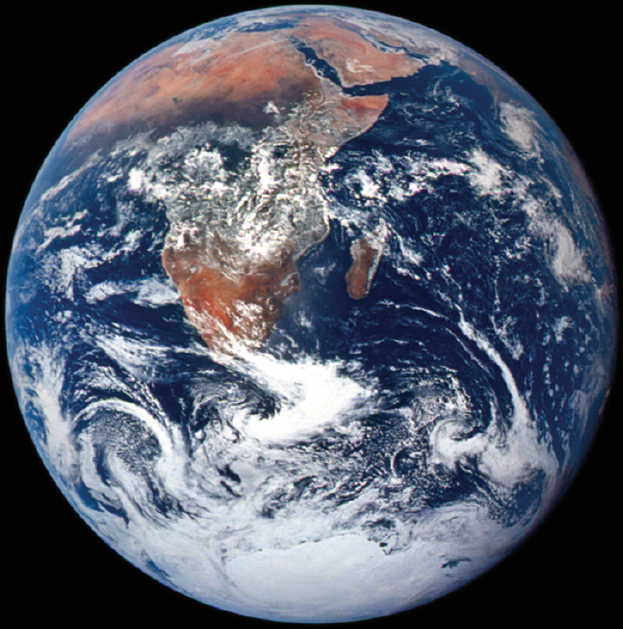
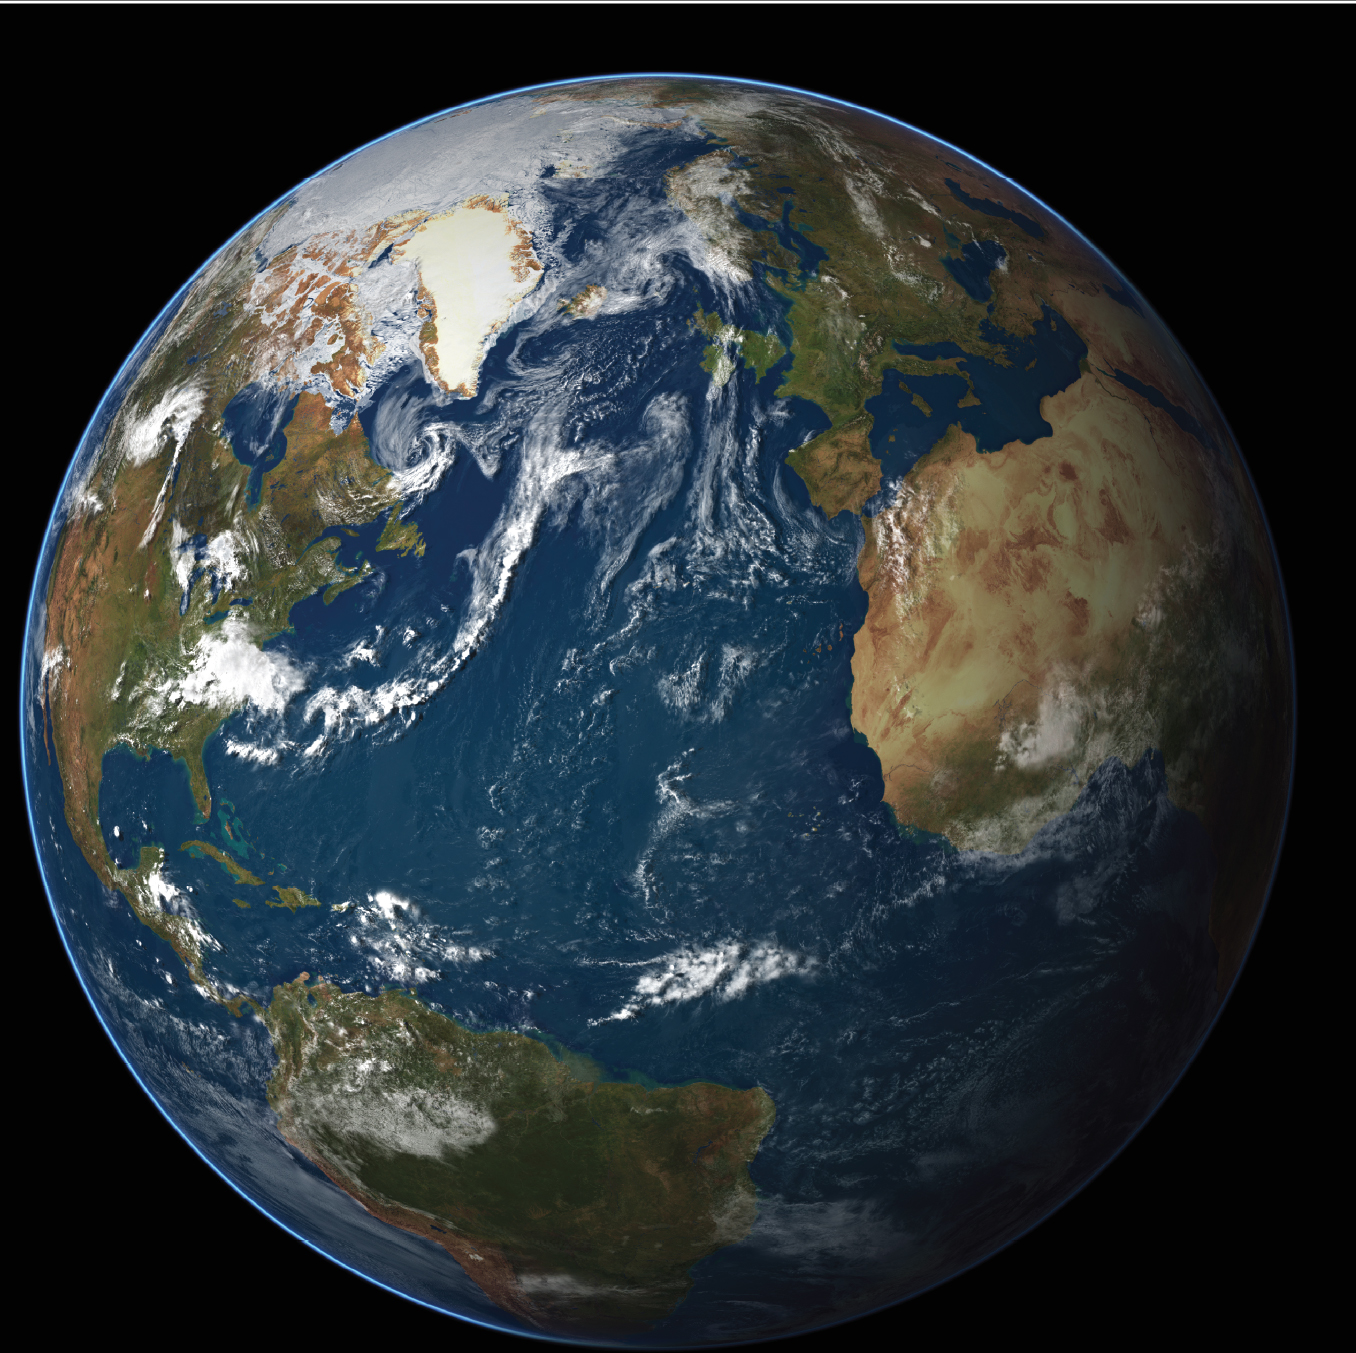
These computer-graphic views show each planet, moon or asteroid from a similar viewpoint and with similar illumination, so their appearance can be directly compared. These views are generated from global maps of each body based on the best available space probe imagery. Each body is shown as close as possible to its natural appearance, so Earth, Venus, and Saturns moon Titan are shown with their characteristic cloud cover. The planets are shown with their correct axial tilt, with a rotation angle (longitude) chosen to show some of their key surface features.
PLANET AND MOON DATA
The vital statistics of each body are grouped into Orbital Data, describing where the body is and how it moves, and Physical Data, describing the size, mass and other physical properties of the body itself.
Two important properties are shown visually on scale bars at the side of the page; Surface Temperature follows a pattern as we move away from the Suns warmth, with the odd exception such as Venus, whose temperature is elevated by the greenhouse effect of its thick atmosphere. Only Earth lies comfortably in the temperature range 0100C where liquid water, so important to life, can exist on the surface.
Mean Density gives us a clue about what the planet or moon may be made of, with small, solid Mercury having a density approaching that of iron, and giant, gassy Saturn being less dense than water.
ORBIT MAPS
The orbit map shows the shape of the orbit of each planet, moon, or asteroid in relation to its neighbors and parent body. The orbits are to true scale and the positions of each body are correct for January 1, 2012.
SCALE MAPS
The scale map shows the size of each planet, moon, or asteroid in comparison to an object that is (we hope!) more familiar. The scale objects range in size from the Earth down to a human being. (The waving human outline weve used to scale the particles of Saturns rings is taken from the plaque on the side of the Pioneer 10 space probe, drawn by Linda Salzman Sagan, wife of the late astronomer Carl Sagan.)


