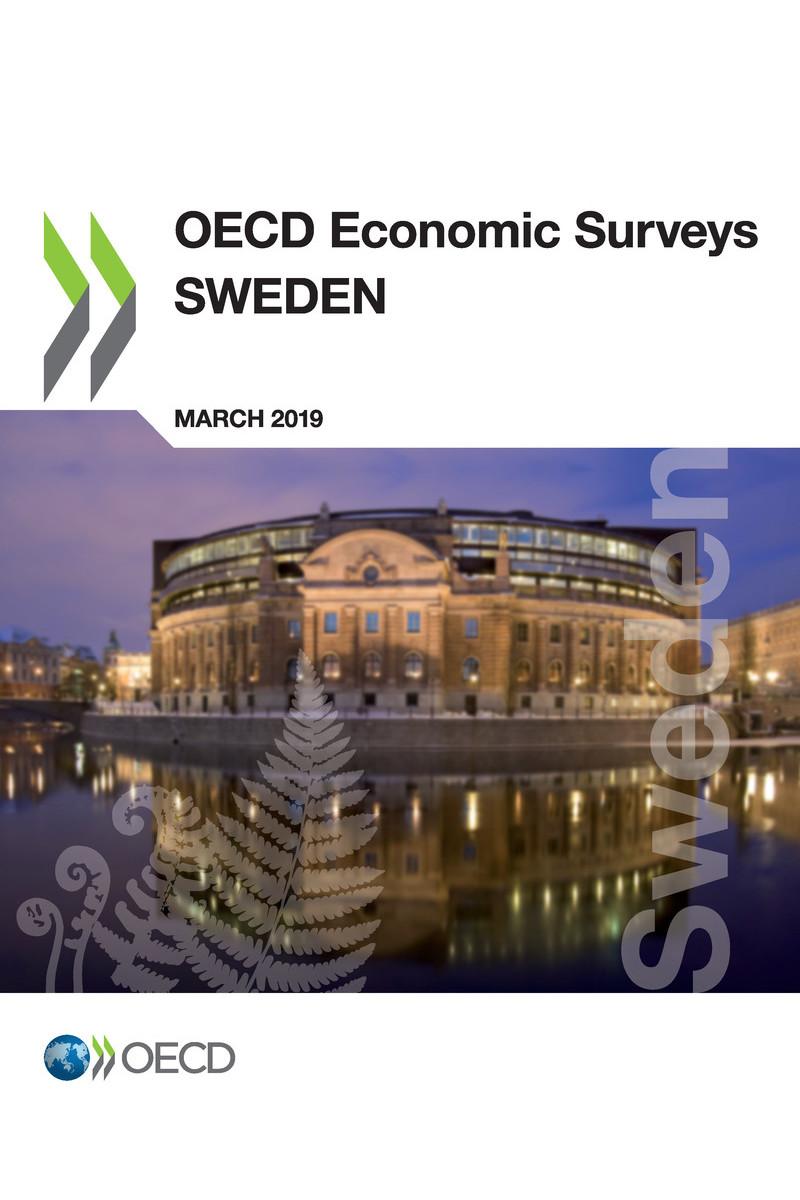
OECD Economic Surveys: Sweden 2019
Please cite this publication as:
OECD (2019), OECD Economic Surveys: Sweden 2019 , OECD Publishing, Paris, https://doi.org/10.1787/c510039b-en .
Metadata, Legal and Rights
ISBN: 978-92-64-62320-0 (print) - 978-92-64-44906-0 (pdf) - 978-92-64-72560-7 (HTML) - 978-92-64-85697-4 (epub)
DOI: https://doi.org/10.1787/c510039b-en
OECD Economic Surveys
ISSN: 0376-6438 (print) - 1609-7513 (online)
OECD Economic Surveys: Sweden
ISSN: 1995-3380 (print) - 1999-0448 (online)
This document, as well as any data and any map included herein, are without prejudice to the status of or sovereignty over any territory, to the delimitation of international frontiers and boundaries and to the name of any territory, city or area.
The statistical data for Israel are supplied by and under the responsibility of the relevant Israeli authorities. The use of such data by the OECD is without prejudice to the status of the Golan Heights, East Jerusalem and Israeli settlements in the West Bank under the terms of international law.
This Survey is published on the responsibility of the Economic and Development Review Committee (EDRC) of the OECD, which is charged with the examination of the economic situation of member countries.
The economic situation and policies of Sweden were reviewed by the Committee on 11 February 2019. The draft report was then revised in the light of the discussions and given final approval as the agreed report of the whole Committee on 1 March 2019.
The Secretariats draft report was prepared for the Committee by Christophe Andr, Jon Kristian Pareliusen and Hyunjeong Hwang, with contributions from Andres Fuentes Hutfilter, under the supervision of Vincent Koen. Secretarial assistance was provided by Sisse Nielsen.
The previous Survey of Sweden was issued in February 2017.
Photo credits: Cover iStockphoto.com/Michael Cavn.
Corrigenda to OECD publications may be found on line at: www.oecd.org/about/publishing/corrigenda.htm .
OECD 2019
You can copy, download or print OECD content for your own use, and you can include excerpts from OECD publications, databases and multimedia products in your own documents, presentations, blogs, websites and teaching materials, provided that suitable acknowledgement of OECD as source and copyright owner is given. All requests for public or commercial use and translation rights should be submitted to .
Executive summary
Economic growth is broad-based
The expansion is strong. GDP has expanded at an average rate of close to 3% over the past five years (Figure A). The upswing has been broad-based, with robust consumption, investment and exports.
Unemployment has receded. Employment has grown steadily and the unemployment rate has fallen (Figure A). But jobseekers are increasingly low-skilled and immigrants, who struggle to find jobs.
Figure A. Robust growth reduces unemployment

Source: OECD Economic Outlook database.
StatLink https://doi.org/10.1787/888933943512
Economic growth will moderate as capacity constraints tighten. Growth will slow, as the economy now operates around full capacity and labour shortages appear in many sectors (Table A). Shrinking residential investment following housing price falls is a further drag on the economy. Exports are expected to remain solid as long as the global economy keeps expanding.
Global uncertainties weigh on the outlook. The global economic environment is laden with uncertainties. As a small open economy highly dependent on exports, Sweden is vulnerable to potential global shocks, such as further intensification in global trade tensions, a disorderly Brexit, stress in European sovereign bond markets, as well as domestic events such as a severe drop of the housing market.
Table A. Economic growth is projected to remain robust |
|---|
Percentage change, unless otherwise specified |
|---|
| 2018 | 2019 | 2020 |
|---|
Gross domestic product | 2.4 | 1.6 | 1.7 |
Private consumption | 1.2 | 1.6 | 2.0 |
Gross fixed capital formation | 3.5 | -0.7 | 1.4 |
Exports | 3.7 | 3.4 | 3.2 |
Imports | 3.1 | 2.5 | 3.2 |
Unemployment rate | 6.3 | 6.2 | 6.1 |
Consumer prices | 2.0 | 2.0 | 2.1 |
CPI with fixed mortgage rate (CPIF) | 2.1 | 2.0 | 2.0 |
Current account (% of GDP) | 2.5 | 3.4 | 3.5 |
General government fiscal balance (% of GDP) | 0.7 | 0.4 | 0.5 |
Source : OECD Economic Outlook, No. 104, updated based on available information as of 28-02-2019. |
Inequality is low and well-being high
Rising employment has contributed to enhancing well-being and reducing poverty. However, robust capital income growth has pushed up inequality over the past few years. Nevertheless, inequality remains low, albeit higher than in the other Nordic countries (Figure B). Amending tax rules for unlisted companies and property, without increasing the overall tax burden, could help hold back inequality.
Figure B. Income inequality remains low
Ratio of ninth to first disposable income decile, 2016 or latest

Source : OECD Income Distribution Database (IDD).
StatLink https://doi.org/10.1787/888933943531
Environmental policies are ambitious

