Appendix D
Multiproject Postmortem Example
Background
An enterprise-wide project postmortem evaluation was initiated at a fast-growing organization that had realized that project performance on development projects needed to improve. A 102-question survey was developed to facilitate this process. All of the most recent sizable projects that were conducted and concluded prior to this survey were included in the evaluation. A group of seven projects was specifically filtered out for one of the major assessments. These seven were all relatively complex R&D projects with established customer contract commitments.
About the Survey
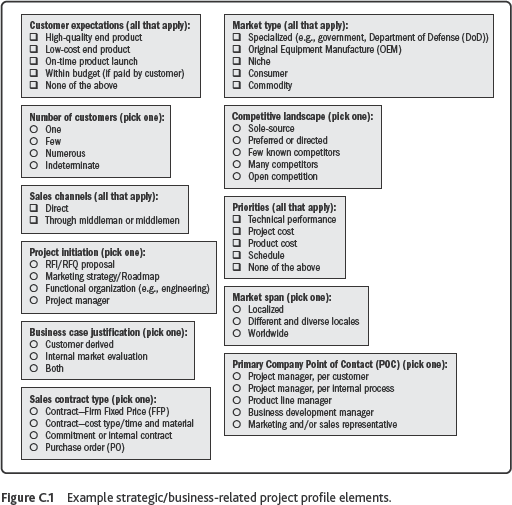
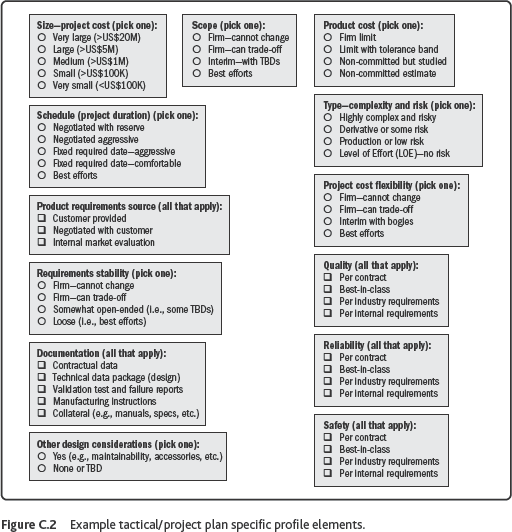
The survey inputs were provided by the project managers assigned to the projects. The survey consisted of 102 questions: seven administrative, 25 for project description, 22 on project management tools and techniques used, 11 relative to overall project performance, and 37 relative to specific project performance. The project description data included the project profile categories listed in fish-bone diagram, and most were rated on a scale from 0 to 4 (0 being the worst rating and 4 being the best). Most of the questions required answers, and the survey typically took about two hours for each of the participants to complete.
Once the survey inputs were collected, the raw data were tabulated and analyzed. It was important to ensure that: (1) the input information remains anonymous to encourage honest assessments, (2) the raw inputs are not altered to ensure 100 percent ownership by the project managers, and (3) the analysis of the data was objectively performed to avoid obvious preconceived biases, and to gain acceptance of systemic corrective action initiatives. Subsequently, a task force team convened to review improvement initiative options and decide on specific systemic corrective actions to implement.
Summary of Survey Inputs
All survey inputs provided below are numbered by the survey question number they correspond to. Not all survey questions were relevant to this set of projects, and some were designed for collecting additional information that is not considered relevant to this analysis.
Relevant Project Profile Data:
3. Shows project management transitionsonly two project managers on the project from start to finish
4. Total project durations between 9 months and 43 months (median of 19 months)
11. Customer priorities and perceptions(1) Quality (Technical), (2) Project Costs, (3) Schedule, and (4) Product Cost
12. All project managers were primary customer points of contact (POCs)
16. Internal priorities and perceptions(1) Quality (Technical), (2) Schedule, (3) Project Costs, and (4) Product Cost
18. Six of seven projects had budgets greater than US$5 million
19. All were considered complex and risky product development projects
20. All were considered to have aggressive project schedules
21. For six of seven projects, most of the requirements were negotiated prior to contract award
22. Some projects were initiated with open-ended requirements
25. All project teams assumed that they could trade off scope if necessary
26. Six of seven projects had firm project budgets
Project Management Tools and Techniques Used:
33. Four of seven used a form of EVMthree of seven used actual-plus-plan costs versus time
36. All seven used a form of IMS Lite scheduling (i.e., no resource loading)
39. All seven used a bottom-up product cost estimation technique
41. All seven used a bottom-up project cost estimation technique to establish baseline budgets
43. All seven used a bottom-up project schedule estimation technique to establish baseline schedules
46. Four of seven used formal risk management techniquesthree of seven used informal (reactive) techniques
49. All teams used several Six Sigma tools and techniquesmostly reactive
51. Requirements management was inconsistently applied and lacking in general
53. Five of seven had some form of project management plan and SOWthe other two projects did not
Summary of Survey Results
Survey results were displayed using the below tables in Figures . Each outcome and performance rating was scored on a scale of 0 to 4. The rating for each input is shown, and the scheme used for evaluating the average scores was provided. This methodology was accepted, along with the final assessment and recommended action plans.
Note that after implementation of the systemic corrective actions delineated in , project performance improved markedly. This was a good first step in attempting to achieve flawless project execution within the performing organization. The general expectation is that with improved project performance comes improved customer satisfaction, and that leads to an improved business outlook.

