Python for Trading on Technical
A step towards systematic trading.
Anjana Gupta
Contents
3.1. Chaikin A/D Oscillator
Disclaimer
This book is educational in nature. Various Derivative contracts traded in Indian market and data used in various examples are for illustrative and educational purpose only. Example/ data used may or may not be based on Historical/factual data. We are not rendering legal/professional services or any kind of advice for trading. Past performance or data or example discussed here does not guarantee of future results. We disclaim any liability/loss/risk resulting directly or indirectly from use or application of any content of this book.
Python for Trading on Technical-
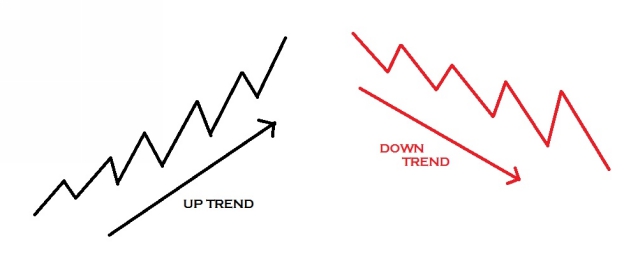
Technical analysis today has its origins in the theories first proposed by Charles Dow in eighteenth century. Dow published his ideas in series of editorials he wrote for wall street Journal. Dow Theory is all about trends. A trend is really nothing more than a somewhat uniform change in price levels over time. For an Uptrend prices start low and through a series of advances and pullbacks move to a higher level. For a down trend prices start high and through a series of advances and pullbacks move to a lower level.
Dow Theory says that the market has three trends. Index/Stock/Commodity is in upper trend when they made higher top and higher lows. It means lows will be higher than previous low and high will be higher than previous high. Index/Stock/Commodity is in lower trend when they made lower top and lower lows as explained in following picture. Third is range bound when stock is neither in up-trend nor in down-trend.
Dow Theory also says that each trend has three phases. Accumulation phase when informed investor buy the stock, public participation phase when prices begin to advance rapidly and distribution phase when informed investor who accumulated stocks on lower prices begin to distribute before anyone else start selling. Dow Theory also says that volume/open interest must confirm the trend. Increase in volume/ open interest with rise in prices will confirm the uptrend and increase in volume / open interest with drop in prices will confirm the downtrend.
So Technical analysis is all about trend buying stock when uptrend begins, ride the trend, and sell when trend ends a high price. A trend follower buys when the price trend is up and sells when the price trend is down. He believes that, if the trend is up then it will continue to go up. If everything works as expected, the trend follower makes money. The trend is always a matter of time interval. In a long run a stock may be in up-trend but in short run the same may be in down trend.
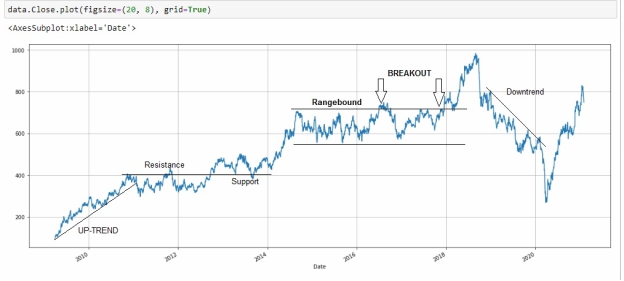
I have taken Mahindra & Mahindra (M&M) prices from year April 2009 to January 2021 in the above chart to explain technical terminology. As we can see in above chart stock was in uptrend from 2009 to 2011 when prices goes up by 500% from 80 to 400. I have drawn a trend line (trend line is simple a straight line that connects a series of security prices either tops or bottoms). Price of 400 was working as resistance in year 2011 and 2012 and the same was working as support in 2013 and 2014. (Support is the price level at which there is adequate demand for a security to stop its downward price movement and Resistance is a price level at which there is significant supply of stock to stop its upward price movement). Usually a resistance work as support when prices break resistance as we have seen above. From year 2015 to 2018 this stock was range bound. We have seen first false breakout in prices in year 2017 when stock beaked all time high. Again we have seen a successful breakout in 2018 and prices goes up from 750 to 1000. In the year 2019 and 2020 the stock was in downtrend. Again a new uptrend started in January 2021. Now we have to see that prices will remain range bound or this uptrend will continue.
Hundreds of technical indicators developed for identification of trend. We can divide these indicators in two categories
Lagging indicators These indicators gives buy/sell signal after price moves.
Leading indicators These indicators give signals before price change.
Chart patterns help us in identification of trend as we have learned in above example. Technicians also have developed many chart patterns for identification of reversal of trend. Some of these discussed below-
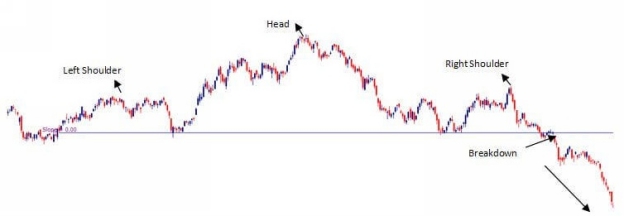
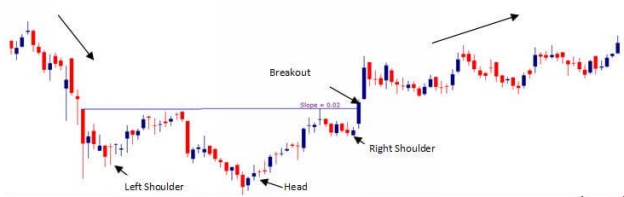
Head and Shoulder pattern
When a price are in uptrend and fails to create a higher high than prices create head and shoulder pattern as shown in following chart. This is an indication of reversal of uptrend and beginning of down trend when neckline is broken as shown in following chart
The same pattern we can observe in prices chart of many stocks when there is reversal in down trend and breakout in the prices above neckline.
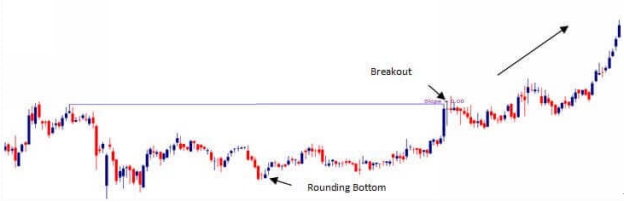
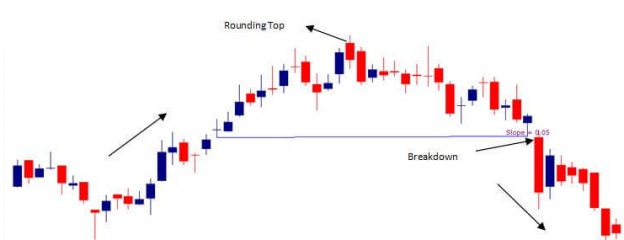
Round Top and Round bottoms
Round top and round bottoms trend reversal pattern is illustrated in the following charts when prices are gradually coming down or going up against the previous trend.
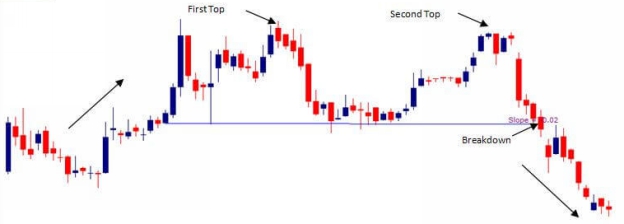
Double top and Double bottom-
As shown in the following example when price in trend fails to create higher highs in case of uptrend or lower lows in case of down trend they reverse from the previous high/low.
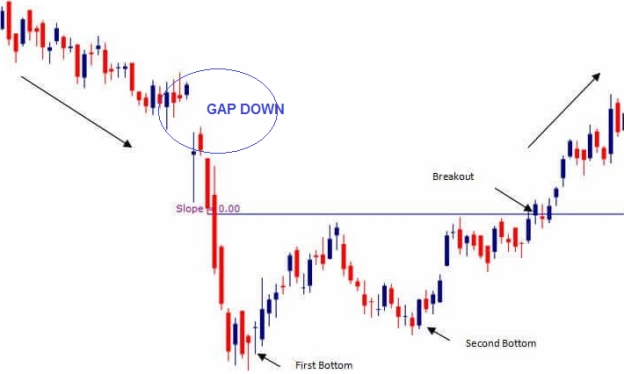
Gaps-
In a uptrend when current period low price is higher than previous period high price (Gap up opening) indicates continuation a uptrend and in case of down trend when a day high price are lower than previous day low price (Gap down opening) is an indication of further down trend. Some technical analyst believes that price comes back once to fill the gap.
Identifying and benefitting from chart patterns constitutes a major part of technical analysis. Different traders use different charts in order to achieve better results in the market. Acquainting yourself with these chart patterns can help you identify better trading opportunities more quickly.
In this book we will work on systematic trading. We will try to develop technical based trading systems that are consistently profitable in various market conditions. When we talk about systematic trading it means all decisions of buy and sell will be taken by system not by intuition of individual. System will generate buy and sell signal. We will also check that these systems are profitable on past data or not. So we are trying to develop systems for trading. Trading is all about making money. Algorithmic trading is all about developing quantitative rules that give you profit. In this book we are going to take some simple ideas and turn them into successful trading strategies. If you cant turn an idea into profitable returns, then you are wasting your time. Trading is really all about making money. With the help of this book you will be able to develop, modify and backtest your own idea on past data to develop your own profitable strategy. You ideas should be based on common sense and than pyhton can help you to get your ideas tested using historical data to be sure they actually work.