USMLE is a joint program of the Federation of State Medical Boards (FSMB) and the National Board of Medical Examiners (NBME), which neither sponsor nor endorse this product.
All rights reserved under International and Pan-American Copyright Conventions. By payment of the required fees, you have been granted the non-exclusive, non-transferable right to access and read the text of this eBook on screen. No part of this text may be reproduced, transmitted, downloaded, decompiled, reverse engineered, or stored in or introduced into any information storage and retrieval system, in any form or by any means, whether electronic or mechanical, now known or hereinafter invented, without the express written permission of the publisher.
2019 by Kaplan, Inc.
Published by Kaplan Medical, a division of Kaplan, Inc.
750 Third Avenue
New York, NY 10017
All rights reserved. The text of this publication, or any part thereof, may not be reproduced in any manner whatsoever without written permission from the publisher. This book may not be duplicated or resold, pursuant to the terms of your Kaplan Enrollment Agreement.
10 9 8 7 6 5 4 3 2 1
ISBN: 978-1-5062-3611-7
Editors
Behavioral Science
- Alice Akunyili, MD
- Assistant Professor, Department of Cell
- Biology and Pharmacology
- FIU Herbert Wertheim College of Medicine
- Miami, FL
- Alina Gonzalez-Mayo, MD
- Psychiatrist
- Department of Veterans Administration
- Bay Pines, FL
- Mark Tyler-Lloyd, MD, MPH
- Executive Director of Academics
- Kaplan Medical
- New York, NY
Basic Science of Patient Safety
- Ted A. James, MD, MS, FACS
Chief, Breast Surgical Oncology
Vice Chair, Academic Affairs
Department of Surgery
Beth Israel Deaconess Medical Center
Harvard Medical School
Boston, MA
The editors would like to acknowledge Kevin Schuller, MD, Irfan Sheikh, MD, and Kevin Yang, MD for their contributions.
We want to hear what you think. What do you like or not like about the Notes? Please email us at medfeedback@kaplan.com.
Part I
Epidemiology and Biostatistics
Epidemiology
Learning Objectives
- Answer questions about epidemiologic measures
- Use knowledge of screening tests
- Explain information related to study designs
Epidemiologic Measures
Epidemiology is the study of the distribution and determinants of health-related states within a population. It refers to the patterns of disease and the factors that influence those patterns.
- Endemic: the usual, expected rate of disease over time; the disease is maintained without much variation within a region
- Epidemic: occurrence of disease in excess of the expected rate; usually presents in a larger geographic span than endemics (epidemiology is the study of epidemics)
- Pandemic: worldwide epidemic
- Epidemic curve: visual description (commonly histogram) of an epidemic curve is disease cases plotted against time; classic signature of an epidemic is a spike in time
The tools of epidemiology are numbers; the numbers in epidemiology are ratios converted into rates. The denominator is key: who is at risk for a particular event or disease state.
To determine the rate, compare the number of actual cases with the number of potential cases:
Rates are generally, though not always, per 100,000 persons by the Centers for Disease Control (CDC), but can be per any multiplier. (Vital statistics are usually per 1,000 persons.)
A disease may occur in a country at a regular annual rate, which makes it endemic. If there is a sudden rise in the number of cases in a specific month, we say that there is an epidemic. As the disease continues to rise and spread to other countries, it becomes a pandemic. Thus the terminology is related to both the number of cases and its geographical distribution.
The graph below represents the incidence of 2 diseases (cases in 100,000). Disease 1 is endemic as the rate of disease is consistent month to month with minor variation in the number of cases. Disease 2 experiences an epidemic in March and April in which the number of cases is in excess of what is expected.
| January | February | March | April | May | June | July | August |
| 3 | 4 | 3 | 4 | 4 | 4 | 3 | 3 |
| 5 | 5 | 8 | 8 | 5 | 5 | 5 | 5 |
|
Although the data is in 100,000 cases, the variation in disease 1 is still consistent when compared to disease 2.
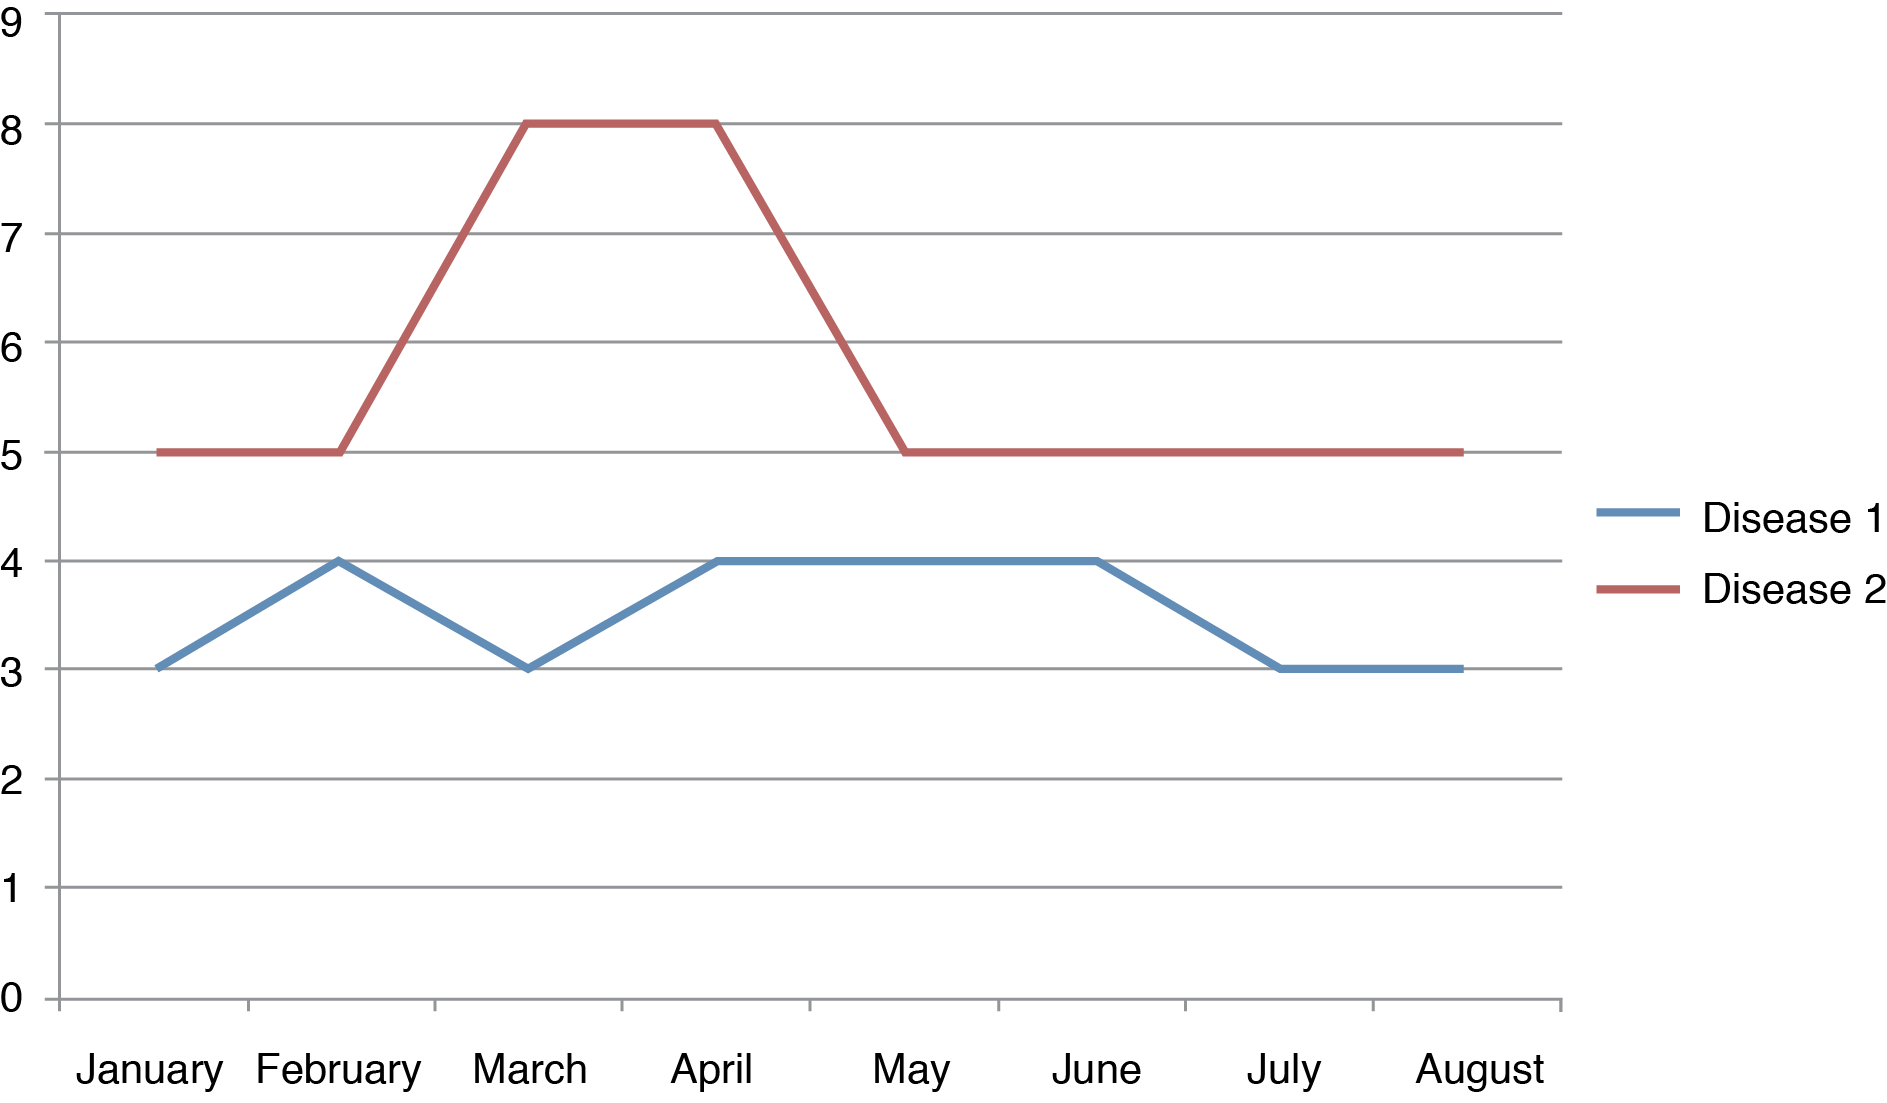
Figure 1-1. Epidemic vs. Endemic Cases
Consider the following scenario. A Japanese farmer begins to sell meat that is infected with salmonella. Within 2 days, hundreds of villagers begin to experience crampy abdominal pain. This is an example of an epidemic. The sudden rise of salmonella gastroenteritis in this village is much higher than the average incidence for the given time period.
Now what if the farmer ships 1,000 pounds of infected beef to other regions of Japan before he realizes what happened? What can one anticipate would happen? The answer is there would be no change to the endemic rate of gastroenteritis. The farmer is only shipping out 1,000 pounds of beef to a few cities nationwide. Unlike the earlier scenario which addressed the population of a village, this would be the entire nation. Assuming that every person who consumes the beef gets gastroenteritis, that number would not significantly increase the national average of cases and would therefore not significantly change the incidence of the disease nationwide.
Incidence and Prevalence
Incidence rate (IR) is the rate at which new events occur in a population.
- The numerator is the number of new events that occur in a defined period.
- The denominator is the population at risk of experiencing this new event during the same period.
The IR includes only newcases of the disease that occurred during the specified period, not cases that were diagnosed earlier. This is especially important when working with infectious diseases such as TB and malaria.
If, over the course of a year, 5 men are diagnosed with prostate cancer, out of a total male study population of 200 (with no prostate cancer at the beginning of the study period), the IR of prostate cancer in this population would be 0.025 (or 2,500 per 100,000 men-years of study).









 Figure 1-1. Epidemic vs. Endemic Cases