STATISTICS
An introduction
Alan Graham
Contents
Acknowledgements
Many thanks to Irene Dale, Tracy Johns, Ian Litton and Kevin McConway for their help and support.
Meet the author
Welcome to Statistics: An introduction !
Hello, my name is Alan; Ive been a lecturer in Mathematics Education at the Open University for more than 30 years. My particular interest is statistics and Ive written a number of books and Open University course units in this field. Ive given numerous workshops and lectures to teachers on a variety of themes, including calculators, spreadsheets, practical mathematics and statistics.
Most statistics textbooks are too difficult to understand. This is not the fault of the people who read them but is down to the unrealistic expectations of the people who write them. Most learners starting statistics are, unsurprisingly, not very confident with handling numbers or formulas, so why pretend they should be?
This book is my attempt to present the basic ideas of statistics clearly and simply. It does not provide a comprehensive guide to statistical techniques if you want that, you will need a different sort of book. Instead, the focus is on understanding the key concepts and principles of the subject. Increasingly, much of the technical side of statistical work performing laborious calculations, applying complicated formulas and looking up values in statistical tables is these days handled by computers and calculators. What really matters is to understand the principles of what you are doing and be able to spot other peoples statistical jiggery-pokery when you come across it.
I believe that the ideas in this book will provide you with a bedrock understanding of what statistics is all about. I have enjoyed writing it. I hope that you will enjoy reading it.
Alan Graham , 2017
Introduction
For most people, the word statistics conjures up working with numbers and doing calculations . Well, accuracy in calculation is certainly important, but these days machines can take care of this side of things. With cheap but powerful calculators and computers around, the job of humans like you and me is to have a clear sense of what you want to do with your data so that you can set the machine to do the correct calculation, and then interpret the answer sensibly. Actually, it is the thinking and understanding that are key here, rather than the mindless number-crunching.
There are two main aims of this book. The first is to make you more confident about handling statistical information (percentages, tables, charts and so on). With this understanding, not only will you be able to grasp what is being said when figures are used, but you should also be better able to protect yourself when scam-merchants try to take you for a ride! A second aim of the book is to give you an understanding of some of the big themes of the subject.
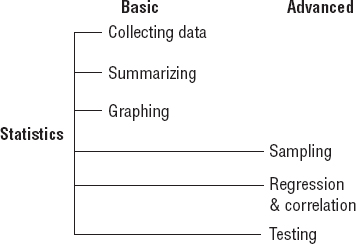
So what are the big ideas of statistics? At the most basic level, they include collecting data (including questionnaire design), summarizing data (including calculating averages) and plotting data in a graph or chart. At a more advanced level, they include sampling, regression and correlation, and carrying out a statistical test of significance (see the diagram below).
Carrying out a statistical investigation
Imagine that you were to tell a student of music that they were required to spend years practising scales and arpeggios but would never get to play a tune. Next try telling a student of soccer that they must devote months to learning how to head, trap and kick a ball but never get to play a game. As you can imagine, both of these students would waste no time in showing their displeasure. Yet this is often what happens when students learn subjects like mathematics and statistics. You can easily go through an entire statistics course learning how to work out averages, plot charts and graphs, calculate coefficients of correlation and so on, but never get to use them in a meaningful investigation. One of the challenges of this book is that while you are learning each new statistical skill you should try to relate it to the bigger picture of how it might be used for real in a simple statistical investigation.
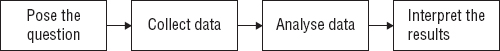
In many textbooks on statistics, the main stages involved in carrying out a statistical investigation are presented in three steps, as set out below:
A statistical investigation with only three stages
However, my concern with this picture is that there is no indication of where these data came from in the first place or why they were ever collected. Without some sense of purpose and direction, statistical activities can easily fall flat on their face, leaving students none the wiser about the power of the statistical ideas they had been using and where they fit into a wider picture.
I would suggest that the vital missing box is located just before the collect data stage and so I suggest adding a fourth stage at the beginning called Pose the question. By starting with a clear, well-formulated question that you really want to investigate, the remaining stages follow naturally and your use of statistical skills and techniques can have a sense of purpose.
So the revised diagram looks like this:
The four stages of a statistical investigation
These four stages of a statistical investigation can be summarized by the letters PCAI. These are set out in the table below.
| Stage 1 | P | Pose the question |
| Stage 2 | C | Collect the data (collecting and recording) |
| Stage 3 | A | Analyse the data (summarizing and plotting) |
| Stage 4 | I | Interpret the results |
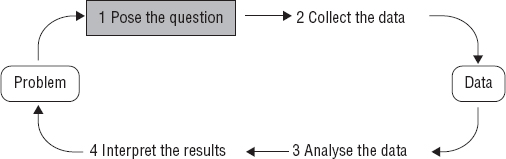
In practice, of course, investigations rarely follow the neat linear path suggested by these sorts of diagrams. It may be more helpful to see the model of statistical investigation as a cycle which you may need to travel around several times before reaching a satisfactory conclusion. This is shown below, with the important, and often neglected, first stage, Pose the question, highlighted.
The four stages of a statistical investigation as a cycle
When you are tackling a statistical investigation yourself, this PCAI cycle can be a very useful aid to your planning. In particular, an awareness of the four PCAI headings can:
help you to think through what needs to be done and when;
provide criteria by which you can judge the quality of your outcomes;
offer a useful set of headings for a write-up or oral presentation of your work;
help you to generate a sense of what it means to be constructively critical of your methodology, always looking for alternative interpretations of the data;
help you to focus attention on the links between successive stages of the cycle and use these as the basis of asking key questions about what you have done and why (for example, the PC link prompts the question, Do the data being collected help to answer the question posed?, and so on); and