coll. - R: Data Analysis and Visualization
Here you can read online coll. - R: Data Analysis and Visualization full text of the book (entire story) in english for free. Download pdf and epub, get meaning, cover and reviews about this ebook. year: 2016, publisher: Packt Publishing, genre: Computer. Description of the work, (preface) as well as reviews are available. Best literature library LitArk.com created for fans of good reading and offers a wide selection of genres:
Romance novel
Science fiction
Adventure
Detective
Science
History
Home and family
Prose
Art
Politics
Computer
Non-fiction
Religion
Business
Children
Humor
Choose a favorite category and find really read worthwhile books. Enjoy immersion in the world of imagination, feel the emotions of the characters or learn something new for yourself, make an fascinating discovery.
R: Data Analysis and Visualization: summary, description and annotation
We offer to read an annotation, description, summary or preface (depends on what the author of the book "R: Data Analysis and Visualization" wrote himself). If you haven't found the necessary information about the book — write in the comments, we will try to find it.
Master the art of building analytical models using R
About This Book- Load, wrangle, and analyze your data using the worlds most powerful statistical programming language
- Build and customize publication-quality visualizations of powerful and stunning R graphs
- Develop key skills and techniques with R to create and customize data mining algorithms
- Use R to optimize your trading strategy and build up your own risk management system
- Discover how to build machine learning algorithms, prepare data, and dig deep into data prediction techniques with R
This course is for data scientist or quantitative analyst who are looking at learning R and take advantage of its powerful analytical design framework. Its a seamless journey in becoming a full-stack R developer
What You Will Learn- Describe and visualize the behavior of data and relationships between data
- Gain a thorough understanding of statistical reasoning and sampling
- Handle missing data gracefully using multiple imputation
- Create diverse types of bar charts using the default R functions
- Familiarize yourself with algorithms written in R for spatial data mining, text mining, and so on
- Understand relationships between market factors and their impact on your portfolio
- Harness the power of R to build machine learning algorithms with real-world data science applications
- Learn specialized machine learning techniques for text mining, big data, and more
The R learning path created for you has five connected modules,which are a mini-course in their own right.As you complete each one, youll have gained key skills and be ready for the material in the next module!
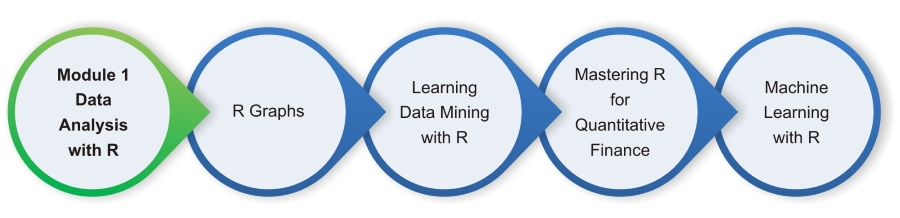
This course begins by looking at the Data Analysis with R module. This will help you navigate the R environment. Youll gain a thorough understanding of statistical reasoning and sampling. Finally, youll be able to put best practices into effect to make your job easier and facilitate reproducibility.
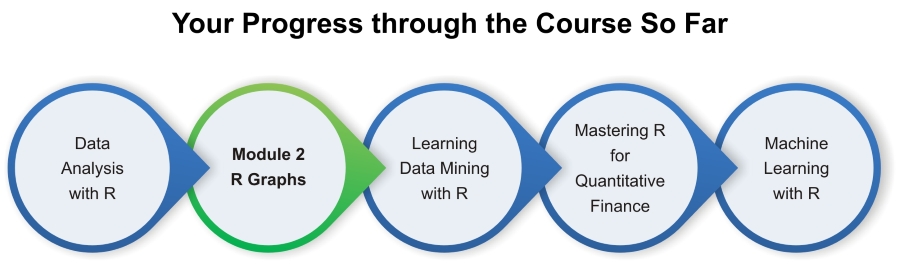
The second place to explore is R Graphs,which will help you leverage powerful default R graphics and utilize advanced graphics systems such as lattice and ggplot2, the grammar of graphics. Through inspecting large datasets using tableplot and stunning 3D visualizations, you will know how to produce, customize, and publish advanced visualizations using this popular and powerful framework.
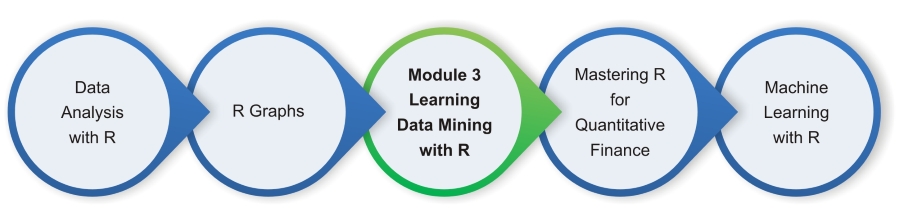
With the third module, Learning Data Mining with R, you will learn how to manipulate data with R using code snippets and be introduced to mining frequent patterns, association, and correlations while working with R programs. You will finish this module feeling confident in your ability to know which data mining algorithm to apply in any situation.
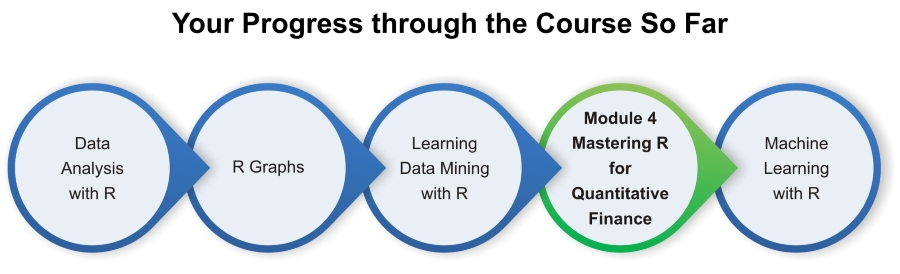
The Mastering R for Quantitative Finance module pragmatically introduces both the quantitative finance concepts and their modeling in R, enabling you to build a tailor-made trading system on your own. By the end of the module, you will be well-versed with various financial techniques using R and will be able to place good bets while making financial decisions.
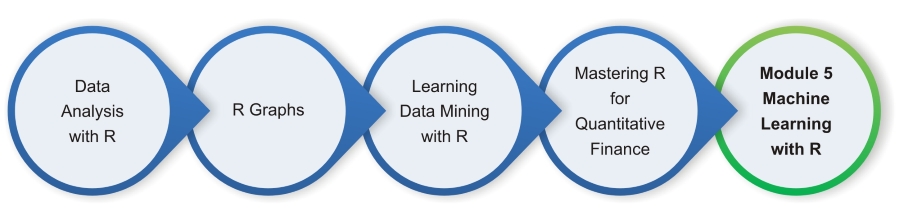
Finally, well look at the Machine Learning with R module. With this module, youll discover all the analytical tools you need to gain insights from complex data and learn how to choose the correct algorithm for your specific needs. Youll also learn to apply machine learning methods to deal with common tasks, including classification, prediction, forecasting, market analysis, and clustering.
Style and approachLearn data analysis, data visualization techniques, data mining, and machine learning all using R and also learn to build models in quantitative finance using this powerful language
coll.: author's other books
Who wrote R: Data Analysis and Visualization? Find out the surname, the name of the author of the book and a list of all author's works by series.


![Thomas Mailund [Thomas Mailund] - Beginning Data Science in R: Data Analysis, Visualization, and Modelling for the Data Scientist](/uploads/posts/book/119629/thumbs/thomas-mailund-thomas-mailund-beginning-data.jpg)

R: Data Analysis and Visualization — read online for free the complete book (whole text) full work
Below is the text of the book, divided by pages. System saving the place of the last page read, allows you to conveniently read the book "R: Data Analysis and Visualization" online for free, without having to search again every time where you left off. Put a bookmark, and you can go to the page where you finished reading at any time.
Font size:
Interval:
Bookmark:
A course in five modules
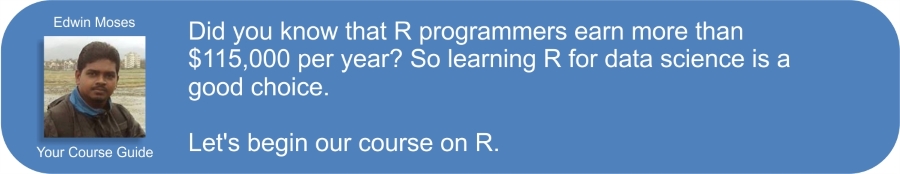
Master the art of building analytical models using R with your Course Guide Edwin Moses

Learn data analysis, data visualization techniques, data mining, and machine learning all using R and also learn to build models in quantitative finance using this powerful language
To contact your Course Guide
Email: <>

BIRMINGHAM - MUMBAI
Welcome to this course on R, the statistical programming language for data scientists and statisticians. With this course, you'll embark on a journey of learning R for data science.
| This course has been designed for you by me Edwin Mosesyour Course Guide. I am here to help you experience a wonderful journey on a tried and tested path. I've designed this course for you and you'll be seeing me through the whole journey, offering you my thoughts and ideas behind what you're going to learn next and why I recommend each step. I'll provide tests and quizzes to help you reflect on your learning, and code challenges that will be pitched just right for you through the course. |
If you have any questions along the way, you can reach out to me over email and I'll make sure you get everything from the course that we've planned for you to become a working R developer. Details of how to contact me are included on the first page of this course.
The R learning path created for you has five connected modules. Each of these modules are a mini-course in their own right, and as you complete each one, you'll have gained key skills and be ready for the material in the next module!
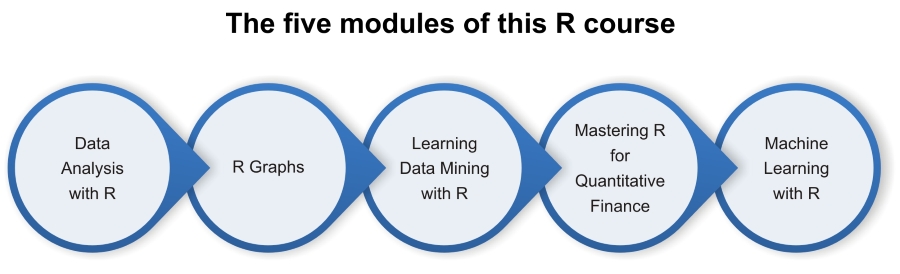
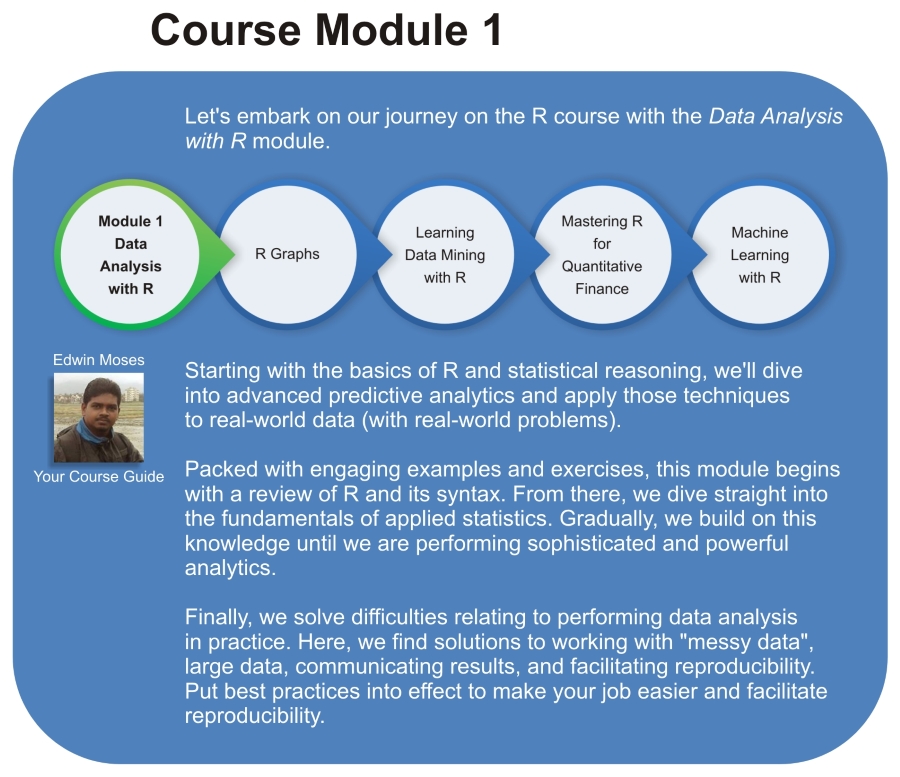
Now, lets look at the pathway these modules create and how they will take you from doing data analysis with R to creating analytical models based on machine learning.
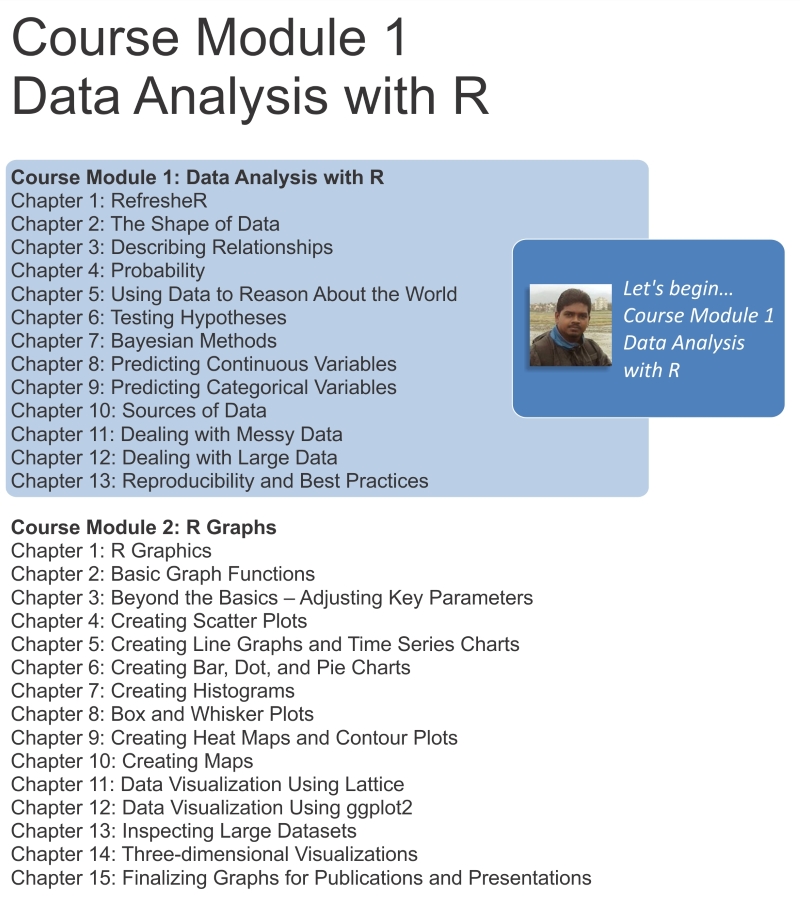
This course begins by looking at the Data Analysis with R module. This module will help you navigate the R environment. You'll gain a thorough understanding of statistical reasoning and sampling. Finally, you'll be able to put best practices into effect to make your job easier and facilitate reproducibility.
The second place to explore is R Graphs . This module will help you leverage powerful default R graphics and utilize advanced graphics systems such as lattice and ggplot2, the grammar of graphics. Through inspecting large datasets using tableplot and stunning three-dimensional visualizations, you will know how to produce, customize, and publish advanced visualizations using this popular, and powerful, framework.
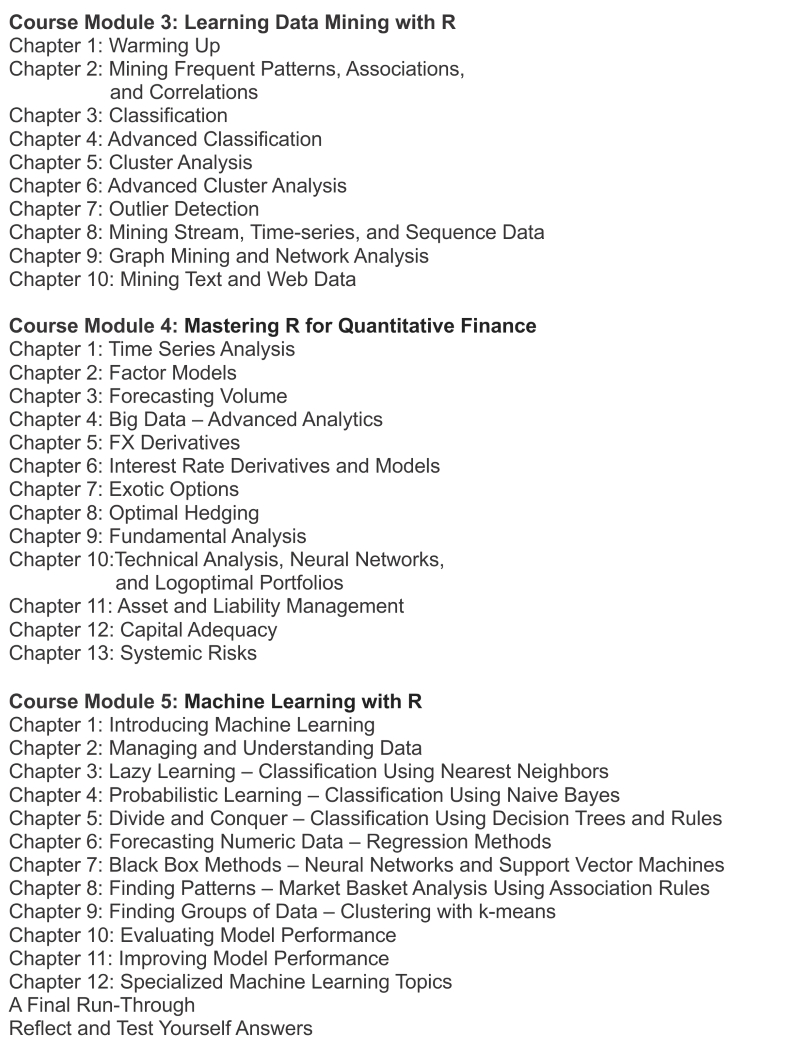
With the third module, Learning Data Mining with R , you will learn how to manipulate data with R using code snippets and be introduced to mining frequent patterns, association, and correlations while working with R programs. Discover how to write code for various predication models, stream data, and time-series data. You will also be introduced to solutions written in R based on RHadoop projects. You will finish this module feeling confident in your ability to know which data mining algorithm to apply in any situation.
The Mastering R for Quantitative Finance module pragmatically introduces both the quantitative finance concepts and their modeling in R, enabling you to build a tailor-made trading system on your own. By the end of the module, you will be well versed with various financial techniques using R and will be able to place good bets while making financial decisions.
Finally, we'll look at the Machine Learning with R module. With this module, you'll discover all the analytical tools you need to gain insights from complex data and learn how to choose the correct algorithm for your specific needs. Through full engagement with the sort of real-world problems data-wranglers face, you'll learn to apply machine learning methods to deal with common tasks, including classification, prediction, forecasting, market analysis, and clustering.
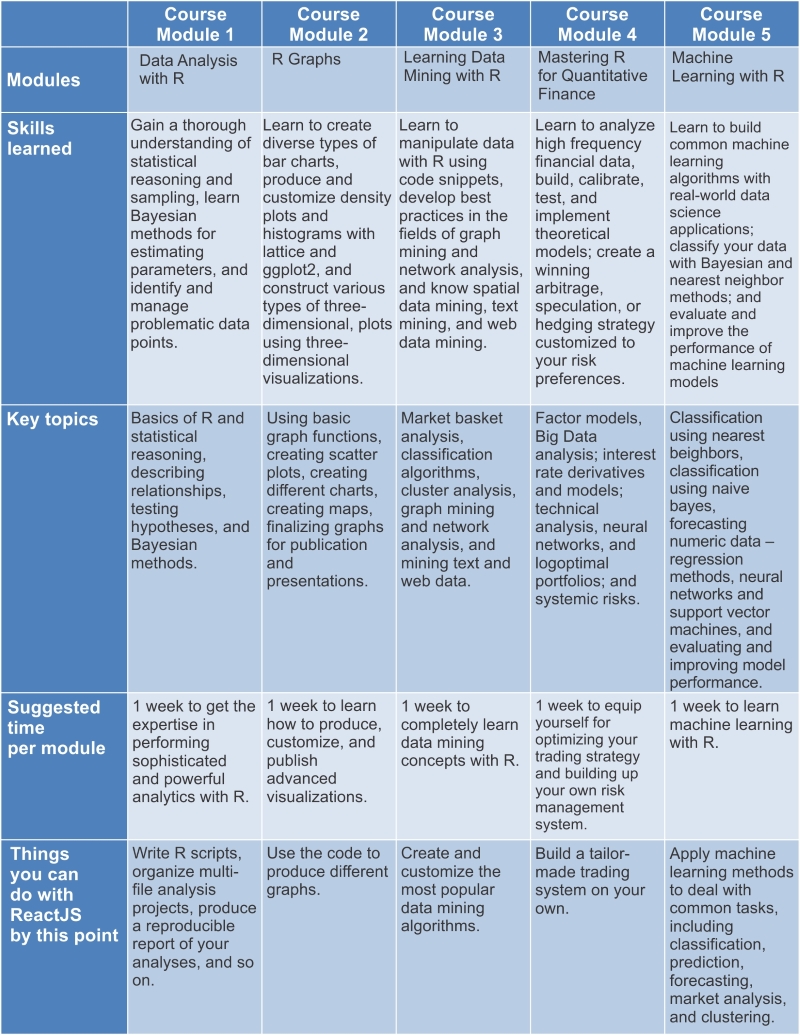
Here's a view of the entire course plan before we begin. This grid gives you a topic overview of the whole course and its modules, so you can see how we will move through particular phases of learning to use R, what skills youll be learning along the way, and what you can do with those skills at each point. I also offer you an estimate of the time you might want to take for each module, although a lot depends on your learning style how much youre able to give the course each week!
Before we dive into the (other) fun stuff (sampling multi-dimensional probability distributions, using convex optimization to fit data models, and so on), it would be helpful if we review those aspects of R that all subsequent chapters will assume knowledge of.
If you fancy yourself as an R guru, you should still, at least, skim through this chapter, because you'll almost certainly find the idioms, packages, and style introduced here to be beneficial in following along with the rest of the material.
Font size:
Interval:
Bookmark:
Similar books «R: Data Analysis and Visualization»
Look at similar books to R: Data Analysis and Visualization. We have selected literature similar in name and meaning in the hope of providing readers with more options to find new, interesting, not yet read works.
Discussion, reviews of the book R: Data Analysis and Visualization and just readers' own opinions. Leave your comments, write what you think about the work, its meaning or the main characters. Specify what exactly you liked and what you didn't like, and why you think so.