it-ebooks - R for Data Science
Here you can read online it-ebooks - R for Data Science full text of the book (entire story) in english for free. Download pdf and epub, get meaning, cover and reviews about this ebook. year: 2018, publisher: iBooker it-ebooks, genre: Computer. Description of the work, (preface) as well as reviews are available. Best literature library LitArk.com created for fans of good reading and offers a wide selection of genres:
Romance novel
Science fiction
Adventure
Detective
Science
History
Home and family
Prose
Art
Politics
Computer
Non-fiction
Religion
Business
Children
Humor
Choose a favorite category and find really read worthwhile books. Enjoy immersion in the world of imagination, feel the emotions of the characters or learn something new for yourself, make an fascinating discovery.

R for Data Science: summary, description and annotation
We offer to read an annotation, description, summary or preface (depends on what the author of the book "R for Data Science" wrote himself). If you haven't found the necessary information about the book — write in the comments, we will try to find it.
R for Data Science — read online for free the complete book (whole text) full work
Below is the text of the book, divided by pages. System saving the place of the last page read, allows you to conveniently read the book "R for Data Science" online for free, without having to search again every time where you left off. Put a bookmark, and you can go to the page where you finished reading at any time.
Font size:
Interval:
Bookmark:
From: http://r4ds.had.co.nz/
This is the website for R for Data Science. This book will teach you how to do data science with R: Youll learn how to get your data into R, get it into the most useful structure, transform it, visualise it and model it. In this book, you will find a practicum of skills for data science. Just as a chemist learns how to clean test tubes and stock a lab, youll learn how to clean data and draw plotsand many other things besides. These are the skills that allow data science to happen, and here you will find the best practices for doing each of these things with R. Youll learn how to use the grammar of graphics, literate programming, and reproducible research to save time. Youll also learn how to manage cognitive resources to facilitate discoveries when wrangling, visualising, and exploring data.
Want a physical copy of this material?
Published by OReilly January 2017 First Edition. Order from amazon.
(R for Data Science was formerly called Data Science with R in Hands-On Programming with R)
This work is licensed under the Creative Commons Attribution-NonCommercial-NoDerivs 3.0 United States License.
Data science is an exciting discipline that allows you to turn raw data into understanding, insight, and knowledge. The goal of R for Data Science is to help you learn the most important tools in R that will allow you to do data science. After reading this book, youll have the tools to tackle a wide variety of data science challenges, using the best parts of R.
Data science is a huge field, and theres no way you can master it by reading a single book. The goal of this book is to give you a solid foundation in the most important tools. Our model of the tools needed in a typical data science project looks something like this:
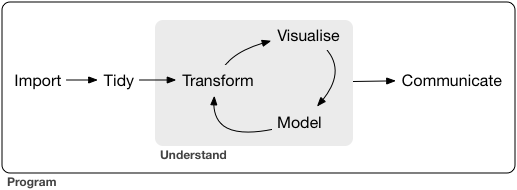
First you must import your data into R. This typically means that you take data stored in a file, database, or web API, and load it into a data frame in R. If you cant get your data into R, you cant do data science on it!
Once youve imported your data, it is a good idea to tidy it. Tidying your data means storing it in a consistent form that matches the semantics of the dataset with the way it is stored. In brief, when your data is tidy, each column is a variable, and each row is an observation. Tidy data is important because the consistent structure lets you focus your struggle on questions about the data, not fighting to get the data into the right form for different functions.
Once you have tidy data, a common first step is to transform it. Transformation includes narrowing in on observations of interest (like all people in one city, or all data from the last year), creating new variables that are functions of existing variables (like computing velocity from speed and time), and calculating a set of summary statistics (like counts or means). Together, tidying and transforming are called wrangling, because getting your data in a form thats natural to work with often feels like a fight!
Once you have tidy data with the variables you need, there are two main engines of knowledge generation: visualisation and modelling. These have complementary strengths and weaknesses so any real analysis will iterate between them many times.
Visualisation is a fundamentally human activity. A good visualisation will show you things that you did not expect, or raise new questions about the data. A good visualisation might also hint that youre asking the wrong question, or you need to collect different data. Visualisations can surprise you, but dont scale particularly well because they require a human to interpret them.
Models are complementary tools to visualisation. Once you have made your questions sufficiently precise, you can use a model to answer them. Models are a fundamentally mathematical or computational tool, so they generally scale well. Even when they dont, its usually cheaper to buy more computers than it is to buy more brains! But every model makes assumptions, and by its very nature a model cannot question its own assumptions. That means a model cannot fundamentally surprise you.
The last step of data science is communication, an absolutely critical part of any data analysis project. It doesnt matter how well your models and visualisation have led you to understand the data unless you can also communicate your results to others.
Surrounding all these tools is programming. Programming is a cross-cutting tool that you use in every part of the project. You dont need to be an expert programmer to be a data scientist, but learning more about programming pays off because becoming a better programmer allows you to automate common tasks, and solve new problems with greater ease.
Youll use these tools in every data science project, but for most projects theyre not enough. Theres a rough 80-20 rule at play; you can tackle about 80% of every project using the tools that youll learn in this book, but youll need other tools to tackle the remaining 20%. Throughout this book well point you to resources where you can learn more.
The previous description of the tools of data science is organised roughly according to the order in which you use them in an analysis (although of course youll iterate through them multiple times). In our experience, however, this is not the best way to learn them:
Starting with data ingest and tidying is sub-optimal because 80% of the time its routine and boring, and the other 20% of the time its weird and frustrating. Thats a bad place to start learning a new subject! Instead, well start with visualisation and transformation of data thats already been imported and tidied. That way, when you ingest and tidy your own data, your motivation will stay high because you know the pain is worth it.
Some topics are best explained with other tools. For example, we believe that its easier to understand how models work if you already know about visualisation, tidy data, and programming.
Programming tools are not necessarily interesting in their own right, but do allow you to tackle considerably more challenging problems. Well give you a selection of programming tools in the middle of the book, and then youll see how they can combine with the data science tools to tackle interesting modelling problems.
Within each chapter, we try and stick to a similar pattern: start with some motivating examples so you can see the bigger picture, and then dive into the details. Each section of the book is paired with exercises to help you practice what youve learned. While its tempting to skip the exercises, theres no better way to learn than practicing on real problems.
There are some important topics that this book doesnt cover. We believe its important to stay ruthlessly focused on the essentials so you can get up and running as quickly as possible. That means this book cant cover every important topic.
This book proudly focuses on small, in-memory datasets. This is the right place to start because you cant tackle big data unless you have experience with small data. The tools you learn in this book will easily handle hundreds of megabytes of data, and with a little care you can typically use them to work with 1-2 Gb of data. If youre routinely working with larger data (10-100 Gb, say), you should learn more about data.table. This book doesnt teach data.table because it has a very concise interface which makes it harder to learn since it offers fewer linguistic cues. But if youre working with large data, the performance payoff is worth the extra effort required to learn it.
Font size:
Interval:
Bookmark:
Similar books «R for Data Science»
Look at similar books to R for Data Science. We have selected literature similar in name and meaning in the hope of providing readers with more options to find new, interesting, not yet read works.
Discussion, reviews of the book R for Data Science and just readers' own opinions. Leave your comments, write what you think about the work, its meaning or the main characters. Specify what exactly you liked and what you didn't like, and why you think so.

