This is a Leanpub book. Leanpub empowers authors and publishers with the Lean Publishing process. Lean Publishing is the act of publishing an in-progress ebook using lightweight tools and many iterations to get reader feedback, pivot until you have the right book and build traction once you do.
Introduction
About the authors
Ari Lerner is a developer with more than 20 years of experience, and co-founder of Fullstack.io. He co-runs ng-newsletter, speaks at conferences, and recently released Riding Rails with AngularJS. He also teaches in-person classes at Hack Reactor and online with airpair.
Victor Powell is a freelance data visualization developer. Prior to freelance, Victor built data visualization tools with YinzCam, Inc. used by NFL, NHL, and NBA sports teams. In his free time, Victor enjoys finding ways to explaining unintuitive or complex mathematical concepts visually. Victor also guest instructs at Hack Reactor.
About this book
The D3 on AngularJS book is packed with the solutions you need to be a D3 and AngularJS expert. AngularJS is an advanced front-end framework released by the team at Google. It enables you to build a rich front-end experience, quickly and easily and D3 is an advanced data visualization framework released by Mike Bostock.
The D3 on AngularJS gives you the cutting-edge tools you need to get up and running on AngularJS and creating impressive web experiences in no time. The goal of this book is not only to give you a deep understanding of how D3 works, but how to integrate it properly into your own AngularJS apps.
With these tools you can dive into making your own dynamic visualizations with AngularJS while being confident in understanding the technology.
Audience
We have written this book for those who have never used AngularJS to build a web application and are curious about how to get started with an awesome JavaScript framework. We assume that you have a working knowledge of HTML and CSS and a familiarity with basic JavaScript (and possibly other JavaScript frameworks). We also assume that youve never written in D3 before, but are interested in learning.
Organization of this book
The first half off the book focuses exclusively on the basics of D3 so well start off assuming you have not used the Library before. In the second half of the book, well cover Angular and how it can be used to make reusable data visualization components. Well also assume you have not used Angular but at the same time, we wont get into too many details of the Library and only cover the concepts that specifically aid in creating reusable and interactive data visualizations.
Additional resources
Since this book does not cover AngularJS in-depth, we urge you to check out the Complete Book on AngularJS at ng-book.com.
We suggest that you take a look at the AngularJS API documentation, as it gives you direct access to the recommended methods of writing Angular applications. It also gives you the most up-to-date documentation available.
Conventions used in this book
Throughout this book, you will see the following typographical conventions that indicate different types of information:
In-line code references will look like:
Hello
.
A block of code looks like so:
1varapp=angular.module('app',[]);23functionFirstController($scope){4$scope.data="Hello";5}
Any command at the command line will look like:
1$ ls -la
Any command in the developer console in Chrome (the browser with which we will primarily be developing) will look like:
1>varobj={message:"hello"};
Important words will be shown in bold.
Finally, tips and tricks will be shown as:
Tip: This is a tip
Development environment
In order to write any applications using AngularJS or D3, we first need to have a comfortable development environment. Throughout this book, well be spending most of our time in two places: our text editor and our browser. We recommend you download the Google Chrome browser, as it provides a great environment to develop in with its convenient and built-in developer tools suite. Its also the browser we used to create the examples. In theory, there should be no differences in the way the examples run on other standards compliant browsers but we cant ever be absolutely sure.
Introducing D3. A simple example
In this chapter, well go over what D3 is and what makes it such a powerful tool for data visualization. Well also introduce a simple Hello World style example that shows how to get quickly get setup and running with D3.
What is it?
D3 (or Data-Driven Documents) is a library written by Mike Bostock for manipulating documents based on data. This means D3s primary job is to take data and produce structured documents such as HTML or SVG with respect to data. Unlike most visualization libraries, D3 is not a ready-made collection of common graphs and widgets. Its common to use D3 to make common graphs, like bar charts and pie charts, but the real power is in its flexibility and fine grain control over the final result.
D3 works well with other established web technologies like CSS and SVG because it doesnt attempt to abstract away the DOM, like many other graphing libraries. This also means D3 will continue to be useful as browsers incorporate new features.
If were just looking for a particular graph type, say, a bar chart, and dont care how exactly it ends up looking, D3 might not be the right library for the job. Several other ready-made libraries exist for creating simple, cookie-cutter charts, such as HighCharts or Chart.js or Google Charts API. If, on the other hand, we have strong requirements for how our visualization should look and function, D3 is a great choice.
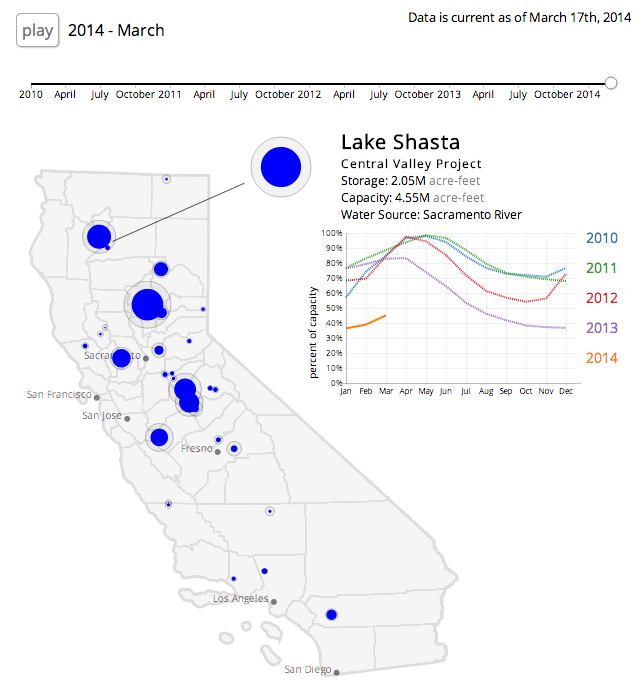
To quickly jump into a real world example of this, take the following interactive visualization produced by KQEDs the Lowdown blog. It doesnt fall into a single, chart category and the different chart components need to communicate with each other, updating dynamically.


![Green Brad - AngularJS: Up and Running: [enhanced productivity with structured web apps]](/uploads/posts/book/193879/thumbs/green-brad-angularjs-up-and-running-enhanced.jpg)

