Daniel A. McGrath Ph.D. [Daniel A. McGrath Ph.D.] - Quantitative Analysis for System Applications: Data Science and Analytics Tools and Techniques
Here you can read online Daniel A. McGrath Ph.D. [Daniel A. McGrath Ph.D.] - Quantitative Analysis for System Applications: Data Science and Analytics Tools and Techniques full text of the book (entire story) in english for free. Download pdf and epub, get meaning, cover and reviews about this ebook. year: 2018, publisher: Technics Publications, genre: Home and family. Description of the work, (preface) as well as reviews are available. Best literature library LitArk.com created for fans of good reading and offers a wide selection of genres:
Romance novel
Science fiction
Adventure
Detective
Science
History
Home and family
Prose
Art
Politics
Computer
Non-fiction
Religion
Business
Children
Humor
Choose a favorite category and find really read worthwhile books. Enjoy immersion in the world of imagination, feel the emotions of the characters or learn something new for yourself, make an fascinating discovery.
![Daniel A. McGrath Ph.D. [Daniel A. McGrath Ph.D.] Quantitative Analysis for System Applications: Data Science and Analytics Tools and Techniques](https://litark.com/uploads/posts/book/119603/daniel-a-mcgrath-ph-d-daniel-a-mcgrath-ph-d.jpg)
- Book:Quantitative Analysis for System Applications: Data Science and Analytics Tools and Techniques
- Author:
- Publisher:Technics Publications
- Genre:
- Year:2018
- Rating:4 / 5
- Favourites:Add to favourites
- Your mark:
Quantitative Analysis for System Applications: Data Science and Analytics Tools and Techniques: summary, description and annotation
We offer to read an annotation, description, summary or preface (depends on what the author of the book "Quantitative Analysis for System Applications: Data Science and Analytics Tools and Techniques" wrote himself). If you haven't found the necessary information about the book — write in the comments, we will try to find it.
Here are just a dozen of the many questions answered within these pages:
- What does quantitative analysis of a system really mean?
- What is a system?
- What are big data and analytics?
- How do you know your numbers are good?
- What will the future data science environment look like?
- How do you determine data provenance?
- How do you gather and process information, and then organize, store, and synthesize it?
- How does an organization implement data analytics?
- Do you really need to think like a Chief Information Officer?
- What is the best way to protect data?
- What makes a good dashboard?
- What is the relationship between eating ice cream and getting attacked by a shark?
Many examples are included that were generated using common software, such as Excel, Minitab, Tableau, SAS, and Crystal Ball. While words are good, examples can sometimes be a better teaching tool. For each example included, data files can be found on the companion website. Many of the data sets are tied to the global economy because they use data from shipping ports, air freight hubs, largest cities, and soccer teams. The appendices contain more detailed analysis including the 10 Ts for Data Mining, Million Row Data Audit (MRDA) Processes, Analysis of Rainfall, and Simulation Models for Evaluating Traffic Flow.
Daniel A. McGrath Ph.D. [Daniel A. McGrath Ph.D.]: author's other books
Who wrote Quantitative Analysis for System Applications: Data Science and Analytics Tools and Techniques? Find out the surname, the name of the author of the book and a list of all author's works by series.
![EMC Education Services [EMC Education Services] - Data Science and Big Data Analytics: Discovering, Analyzing, Visualizing and Presenting Data](/uploads/posts/book/119625/thumbs/emc-education-services-emc-education-services.jpg)


Quantitative Analysis for System Applications: Data Science and Analytics Tools and Techniques — read online for free the complete book (whole text) full work
Below is the text of the book, divided by pages. System saving the place of the last page read, allows you to conveniently read the book "Quantitative Analysis for System Applications: Data Science and Analytics Tools and Techniques" online for free, without having to search again every time where you left off. Put a bookmark, and you can go to the page where you finished reading at any time.
Font size:
Interval:
Bookmark:
List of Tables
CHAPTER 6
Fundamental Quantitative Analysis for Systems
I have worked for many managers with a wide range of quantitative abilities. I have learned from them all. One of the managers took a moment to sit with me when he first arrived to describe features that would make his job easier. He first described how full his calendar is every day, and how utterly random the subject of each meeting is when looked at in total. He said he can sometimes spend up to the first 15 minutes of a meeting trying to shift mental gears, but it is easier when he has some graphs that serve as a focusing aid. He requested a few components be included in a presentation:
- How many items are there? Tens, hundreds, thousands?
- How long is the processing time? Hours, days, months, years?
- What direction is good? Is the goal to increase or decrease the count?
- How do these numbers compare to where we were last week, last month, and last year?
These requests were easy to accommodate, and I was effective in spreading the request to other analysts. It communicated his approach to decision making steady and disciplined. It also served as a good foundation for doing quantitative analysis.
Being a data scientist is like being an offensive lineman: no one notices you until you do something wrong! There are fundamental aspects that must always be followed such as being disciplined in approach and rigorous in execution. Many people play fast and loose with data. The world of data science needs to be more structured so that truthful and useful solutions are achieved. Sometimes extenuating situations can scuttle an endeavor, but if the analysis was fundamentally sound, the analysis can be extended to solve related issues.
This chapter is broken into three parts: a discussion of exploratory tools, an introduction to the basic tool kit for quality analysis, and three technical sections that highlight fundamentals for descriptive statistics, inferential statistics, and modern tools for the analysis of big data. There are many good textbooks that provide in-depth knowledge for how to apply these tools. There are also many software packages to aid with this analysis that include extensive training modules to support mastery. The intent herein is to demonstrate how and when quantitative analysis approaches can be used.
Exploratory data analysis
The most exciting phrase to hear in science, the one that heralds new discoveries, is not Eureka! (I found it!), but Thats funny
Isaac Asimov
As with all scientific endeavors, performing an analysis opens the door to the unknown. This is also true for data analysis. The writings of John Tukey are fascinating. His article with Martin Wilks is a must read to understand the fundamentals of data science circa 1965. Warning, we still have not mastered the key points that they described! It is truly fascinating to read what the great thinkers were expecting to happen by the computer revolution. They would be shocked about how much time ends up being wasted on the web versus actually doing work. Tukey coined the term Exploratory Data Analysis in his book title from 1977 that provides the following gems of wisdom:
Exploratory data analysis can never be the whole story, but nothing else can serve as the foundation stone as the first step...Unless exploratory data analysis uncovers indications, usually quantitative ones, there is likely to be nothing for confirmatory data analysis to consider. (page 3)
He was a world-class data scientist before the computer age. He figured out how to make powerful visualizations using typewriters and found patterns and trends using only an inquiring mind. One of his most powerful tools was the box-and-whisker plot, shown in Figure 4-5. Much has been written on the analysis of measures of central tendency (including in this book), but he was focused on analyzing variance in 1987, shown in Table 6-1. When analytics tools are rolled out, most of these techniques are not addressed. It is obvious that they are still rafts in the iceberg-filled sea. There is much yet to be learned. As big data are a new development, expect there to be many new tools unveiled each year for the foreseeable future.
The first big targets for exploration are granularity and decomposition. Data must be chunked to be processed when it is collected over time or space with the finer divisions taking longer to process. Data can be decomposed along many lines and hierarchies as dictated by the system itself. Software tools exist to help with these initial steps. It is an easy analysis because one just follows the Voice of the Data and determines which fields are the most important just by following the natural course.
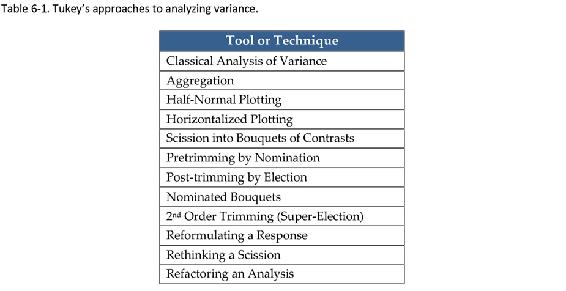
Tukeys approaches to analyzing variance.
The strategy is also called unpeeling the onion because each layer is unfolded, straightened, and reviewed in order to learn what is unique about that layer. The process slows when additional layers are investigated, because those discoveries must be joined with the knowledge acquired from the previous layers. Once this decomposition is finished, the data scientist is buried in an avalanche of knowledge that must be presented and prioritized for action. The output of this exploration is frequently named a multi-vari study and is often presented as an appendix to the study. It usually works best to present this appendix individually to each individual stakeholder so that free and open discussions can occur.
What about missing data points?
They are missing. There are approaches to accommodate them that border on magic and voodoo, but the bottom line is you do not know what you do not know. The only correct way to handle missing data points is to show that the confidence level and error bars are slightly larger so that decision making must be made with more uncertainty. If a data point falls below the detection limit, a two-phased approach must be taken in that the count of measurable data (an attribute) is first reported, and then it is reported as a percentage of completeness. Finally, descriptive statistics can be applied to the subset that is reported of having measured values. This is often seen on Election Night when the talking heads report that candidate X has a 10-point lead with 67% of the precincts reporting. Inferences can be made about the missing data, but a winner cannot be named until those votes are counted. However, if you are in the realm of large numbers, then a few missing data points will not be as influential. If there is a chance that data will be lost, then sampling frequency should be increased as a hedge. The tools of big data make this easier than it was in the old days when people used stubby yellow pencils and Big Chief tablets.
Descriptive statistics
Descriptive statistics are used most often during the quantitative analysis of a system. They are like knives to a chef. There are many kinds of software to use depending on where the data resides and the intensity of the analysis to be performed. There are four parameters that are captured when the descriptive statistics are generated: central tendency, variation, distribution, and ranking. The technical term is univariate analysis .
Central tendency
There are three values that are used to describe the center of a data set. The mean or average is calculated by the sum divided by the total number. The median is the mid-point with one half of the values above and below this number. The mode is the most frequently occurring number. These three values can vary for the same data set. Sometimes the values that correspond to the 25 th and 75 th percentiles are captured to bound the center half of the data.
Next pageFont size:
Interval:
Bookmark:
Similar books «Quantitative Analysis for System Applications: Data Science and Analytics Tools and Techniques»
Look at similar books to Quantitative Analysis for System Applications: Data Science and Analytics Tools and Techniques. We have selected literature similar in name and meaning in the hope of providing readers with more options to find new, interesting, not yet read works.
Discussion, reviews of the book Quantitative Analysis for System Applications: Data Science and Analytics Tools and Techniques and just readers' own opinions. Leave your comments, write what you think about the work, its meaning or the main characters. Specify what exactly you liked and what you didn't like, and why you think so.