Gilchrist - A Practical Guide to Wireshark Forensics for DevOps
Here you can read online Gilchrist - A Practical Guide to Wireshark Forensics for DevOps full text of the book (entire story) in english for free. Download pdf and epub, get meaning, cover and reviews about this ebook. year: 2015, genre: Home and family. Description of the work, (preface) as well as reviews are available. Best literature library LitArk.com created for fans of good reading and offers a wide selection of genres:
Romance novel
Science fiction
Adventure
Detective
Science
History
Home and family
Prose
Art
Politics
Computer
Non-fiction
Religion
Business
Children
Humor
Choose a favorite category and find really read worthwhile books. Enjoy immersion in the world of imagination, feel the emotions of the characters or learn something new for yourself, make an fascinating discovery.

- Book:A Practical Guide to Wireshark Forensics for DevOps
- Author:
- Genre:
- Year:2015
- Rating:3 / 5
- Favourites:Add to favourites
- Your mark:
A Practical Guide to Wireshark Forensics for DevOps: summary, description and annotation
We offer to read an annotation, description, summary or preface (depends on what the author of the book "A Practical Guide to Wireshark Forensics for DevOps" wrote himself). If you haven't found the necessary information about the book — write in the comments, we will try to find it.
Gilchrist: author's other books
Who wrote A Practical Guide to Wireshark Forensics for DevOps? Find out the surname, the name of the author of the book and a list of all author's works by series.


A Practical Guide to Wireshark Forensics for DevOps — read online for free the complete book (whole text) full work
Below is the text of the book, divided by pages. System saving the place of the last page read, allows you to conveniently read the book "A Practical Guide to Wireshark Forensics for DevOps" online for free, without having to search again every time where you left off. Put a bookmark, and you can go to the page where you finished reading at any time.
Font size:
Interval:
Bookmark:
CopyrightAlasdair Gilchrist 2015
Wireshark is an open source, network protocol analyzer for Linux and Windows. It has many features as standard such as deep inspection of hundreds of protocols, live capture and offline analysis. Wireshark has an intuitive GUI frontend plus many inbuilt sorting and filtering options making it very simple to use even for beginners. Tshark is the terminal version of Wireshark which is very similar to Tcpdump.
Wireshark works simply by placing the network card on the machine on which it is running into what is called promiscuous mode. In this more of operation the network card will accept any network information not just information specifically addressed to itself, which is the normal mode of operation.
In a hub network, which is rare these days, this will be sufficient as all network traffic will be send out every port on the hub thereby ensuring that the Wireshark network card would receive all traffic traversing the network. Today's modern networks are not hubs though, they are switches, which means only traffic destined for a host station known to be connected on a port is send out that port. This greatly reduces unnecessary traffic on the network. Unfortunately, this means that Wireshark will not receive all the traffic on the network as it will only see traffic exiting the switch, which is destined for its own directly connected network card.
The solution to the switched network dilemma is to use a technique on the switch to mirror traffic from all the ports on the switch out the port connecting the Wireshark network card. By doing this Wireshark will then see all the network traffic.
Wireshark is available for free download here:
https://www.wireshark.org/download.html
The latest stable version at time of writing (May 2015) is 1.12.4
There is also a video introduction to Wireshark here:
https://www.wireshark.org/video/wireshark/introduction-to-wireshark/
The first thing to do before starting to capture packets on a network, is to make sure you have permission, running Wireshark on your company network without permission is not a good idea. However if you have permission then, first select one or more of the interface cards on the machine running Wireshark to be the capturing interface. This is done from the Wireshark applications front page (Start) or from Capture Options directly below Start. Clicking on the default Capture Options will give you this screen:
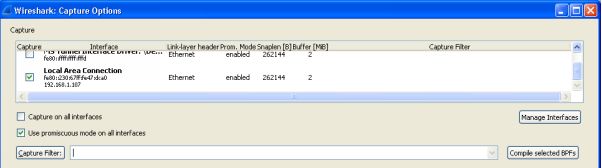
Select the interface and a capture filter if required. It is best to enter a capture filter because if you do not you will capture absolutely everything on the wire which is going to be overwhelming. Wireshark is very flexible and there are many inbuilt filters available, by clicking on the Capture Filter button you will see many filters that can be customized to suit your purposes. For example you can select a protocol to be captures such as TCP or UDP, traffic from a given machine's IP address or MAC address, ignore broadcasts, or a combination of all three.
Once the network interface has been configured and optionally a filter applied click start and the packets will soon start to be listed. Click on the stop capture button on the ribbon at the top when you wish to terminate the capture.
Wireshark color-codes the packets on the screen so that you can easily differentiate between protocols and even different streams. By default green is TCP, light blue UDP, and black is packets with problems such as out of order.
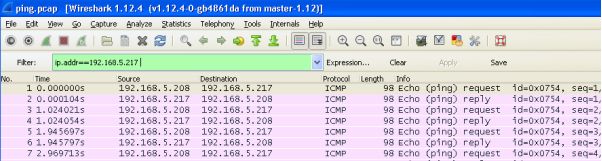
Once you have captured your traffic you can refine what is displayed using the filter option at the top of the page. Filtering will limited what is displayed and is very handy for isolating traffic of interest. For example in the image below a filter has been applied to limit the displayed traffic to be only traffic from or to host 192.168.5.217
If you have no traffic on a network or you do not have permission to capture traffic you can alternatively learn how to use Wireshark using the many sample capture files on the Wireshark Wiki page.
However, in the examples that follow, we are going to show you how to analyze some sample captured files that really show what you can do with Wireshark once you start to apply forensic analysis.
The sample files that we are going to use in the following forensic analysis tutorials you can find here:
A - Ping.pcap
- What type of ICMP traffic is shown in this capture?
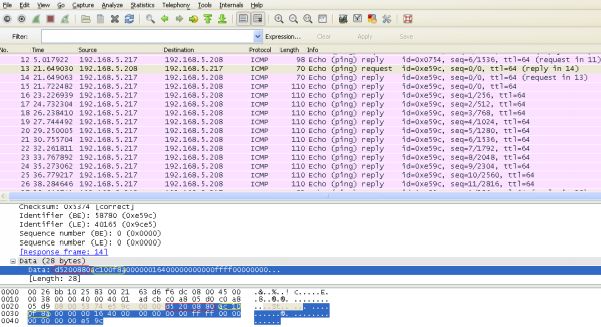
The type of ICMP traffic in the traffic scan is ICMP echo ping requests (type 8) and echo ping replies (type 0) this can be determined by analyzing the ping.pcap with Wireshark or a similar protocol analyser, as shown above.
In the main information panel, we can see that the protocol on view is ICMP (Internet Control Message Protocol) and the information section shows the message types to be echo request and replies between 192.168.5.208 and 192.168.5.217 though they are carrying non-standard ICMP payload.
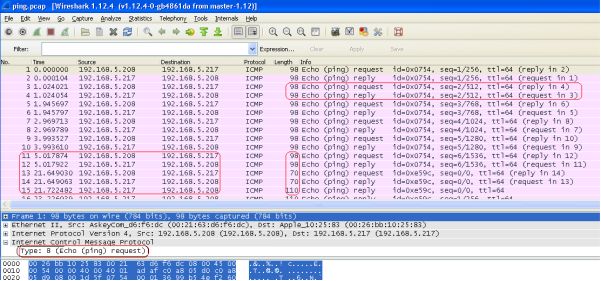
2. What is the number of the first frame that indicates that something funny
might be going on?
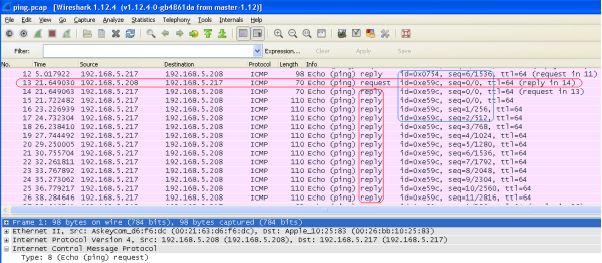
The first indication that something might not be all it seems is at frame number 13 . Prior to this point the ping requests, both request and replies were a uniform size of 98 bytes. From Frame 13 onwards the echo request and reply packets no longer followed any uniformed pattern, in some cases the replies were much larger than the requests, for example the response to echo request 13, takes 14 16 packets to deliver. This was an indication that something more than standard ping test data is being carried within the payload of the ICMP packets. Also from the pcap file, we can see in Wireshark that the identifier and sequence changes in frame 13, which is also indicative of a covert channel being established.
3. What is the application layer protocol that is hidden within the ICMP traffic?
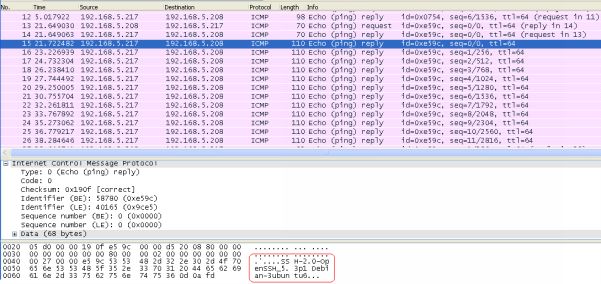
The application layer protocol that is hidden within the ICMP payload and being tunneled through ICMP echo request/replies is SSH. This can be seen from frames 15 onwards when the client is negotiating security protocols with the Linux server.
4. What tool most likely generated this 'malicious' traffic?
The most likely tool used to generate this type of tunneled traffic over ICMP is Ping Tunnel, which establishes a covert connection between two remote computers (a client and proxy), using ICMP echo requests and reply packets to establish a covert channel between a client, a proxy and a destination machine.
Font size:
Interval:
Bookmark:
Similar books «A Practical Guide to Wireshark Forensics for DevOps»
Look at similar books to A Practical Guide to Wireshark Forensics for DevOps. We have selected literature similar in name and meaning in the hope of providing readers with more options to find new, interesting, not yet read works.
Discussion, reviews of the book A Practical Guide to Wireshark Forensics for DevOps and just readers' own opinions. Leave your comments, write what you think about the work, its meaning or the main characters. Specify what exactly you liked and what you didn't like, and why you think so.