Age at Marriage
There are only fragmentary data about American marriage patterns before 1850. The scattered eighteenth-century community studies based on church records suggest that age at first marriage may have averaged about 23 for women and 25 for men (Wells, ) .
Eighteenth-century estimates of marriage age on both sides of the Atlantic are probably understated due to systematic migration censoring. In particular, community estimates derived from church records usually depend on linking baptism records to marriage records, and such estimates exclude people who left the community before they got married. Because of the competing risk of out-migration, late marriages are systematically omitted (Fitch & Ruggles, ) .
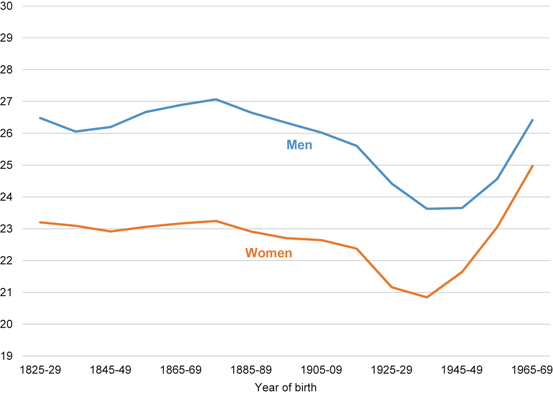
Historical demographers have argued that age at marriage rose in the USA in the first half of the nineteenth century (Hacker, ) . The available evidence, however, is insufficient to verify that conjecture. More likely, American marriage age changed little in the century preceding 1850. The first reliable national estimates are based on census data. The mean age at marriage for the US cohorts born in the late 1820s (and marrying around 1850) was 23.2 for women and about 26.5 for men. This is about the same as the eighteenth-century estimates for women and just a little higher for men .
Figure ) . The estimates are confined to the free population, which means that most blacks are excluded in the period before emancipation .
Fig. 1
Mean age at first marriage: US persons born 18251969. (Source: Calculated from Ruggles et al., )
For people born in the nineteenth century, fluctuations in marriage age were modest. There was a slight increase in marriage age between the birth cohorts of 18351839 and 18751879, especially among men. For the next two generations, marriage age declined gradually. The post-World War II marriage boom mainly affected people born between 1925 and 1949, who married younger than any previous generations. After 1949, marriage age increased sharply, especially for women, and the age difference between husbands and wives narrowed. By the late baby boom generationthose born from 1965 to 1969marriage age for women was substantially later than at any previous period, and marriage age for men was about the same as the previous peak .
Cohort measures of mean marriage age are ideal for describing shared generational experience. The disadvantage of the cohort approach is that we must wait for the cohort to pass out of the marrying ages before we can describe that experience, so the method cannot be used to describe recent change. Moreover, cohort life table measures of mean age at marriage blend the experience of multiple age-groups, blurring the impact of short-run period change.
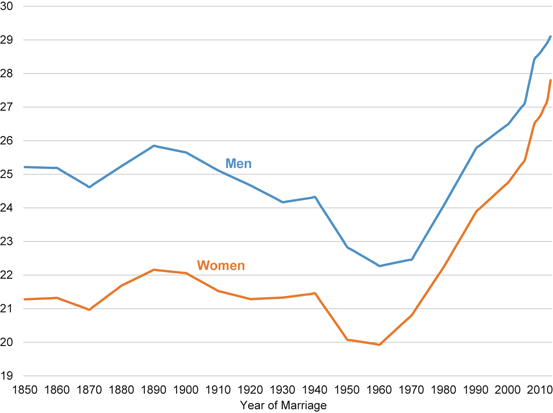
Figure ) , calculated from marital status at single years of age. The median age is consistently a year or so younger than the mean because of the positive skew of marriage age. It better reflects the typical experience of the population, but is not directly comparable with historical or contemporary international estimates of marriage age, which generally use the mean .
Fig. 2
Median age at first marriage: USA, 18502013. (Source: Calculated from Ruggles et al., )
The period estimates in Fig. , and they reveal the contours of recent changes in marriage age. Age at marriage dipped slightly after the Civil War (which ended in 1865), and then rose steadily from 1870 to a peak in 1890. From 1890 to 1960, marriage age fell for both men and women. The drop was interrupted in 1940, the only depression year represented in the data. Following the postwar marriage boom, age at first marriage has increased at an unprecedented pace since 1960. During the past decade, the increase has accelerated sharply, reaching a peak age of 29.1 for men and 27.8 for women in 2013 .
Prevalence of Marriage
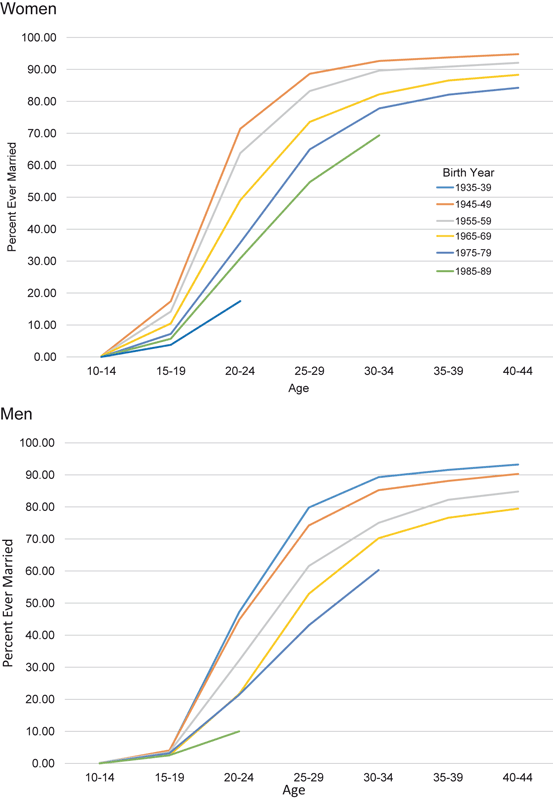
The declining prevalence of marriage is occurring across all age-groups. Figure shows the age pattern of percent ever married among men and women for each successive cohort born since 1935. Among the youngest cohort of womenwho can only be observed through age 2024only 17.5% have married, compared to 71.4% of the same age-group in the 19351939 cohort.
Fig. 3
(Top panel) Percentage of women and men ever married by age and birth cohort: USA, 19351989. (Source: Ruggles et al., )
How many of these young people will eventually marry? By fitting marriage curves derived from historical data, Goldstein and Kenney () concluded that about 90% of the younger cohorts will eventually marry. Since then, however, the young have continued to diverge sharply from historical marriage patterns , and Goldstein and Kenneys predictions are not coming true. In the context of rapid change in marriage behavior, the historically based marriage models are inadequate.
People do not have unlimited opportunities to marry, so a delay in marriage necessarily increases the chances that marriage will not occur. Empirically, it has been unusual for a cohort to forgo marriage early on but then catch up in later life. Among the 15 birth cohorts of women I have reconstructed for persons born between 1825 and 1965, there is only one in which the percentage married at age 2024 did not accurately predict the percentage who had married by age 4044. That exceptional birth cohort was born between 1915 and 1919; they reached age 18 between 1933 and 1938 and 24 between 1939 and 1943. Under the adverse conditions of depression and World War II during their prime marrying years, many of these women delayed marriage. In the end, however, they did catch up; only 6% had never married by the time they reached 4044 years old in the postwar years. If this cohort had behaved like all the others, their non-marriage would have been about 50% higher.
There was no catch-up for the other 14 cohorts I examined: In all other periods, the percentage ever married at age 2024 (with a log transformation) predicts almost perfectly the percentage never married by age 4044. The scatter plot in Fig. ) have any relevance for the youngest cohorts.
