Copyright 2020 - All rights reserved.
The content contained within this book may not be reproduced, duplicated or transmitted without direct written permission from the author or the publisher.
Under no circumstances will any blame or legal responsibility be held against the publisher, or author, for any damages, reparation, or monetary loss due to the information contained within this book. Either directly or indirectly.
Legal Notice:
This book is copyright protected. This book is only for personal use. You cannot amend, distribute, sell, use, quote or paraphrase any part, or the content within this book, without the consent of the author or publisher.
Disclaimer Notice:
Please note the information contained within this document is for educational and entertainment purposes only. All effort has been executed to present accurate, up to date, and reliable, complete information. No warranties of any kind are declared or implied. Readers acknowledge that the author is not engaging in the rendering of legal, financial, medical or professional advice. The content within this book has been derived from various sources. Please consult a licensed professional before attempting any techniques outlined in this book.
By reading this document, the reader agrees that under no circumstances is the author responsible for any losses, direct or indirect, which are incurred as a result of the use of information contained within this document, including, but not limited to, errors, omissions, or inaccuracies.
Table of Contents
Comprehensive Beginners Guide to
Learn Statistics using IBM SPSS from A-Z
Simple and Effective Strategies for Mastering
Statistics Using IBM SPSS From A-Z
: Fusion of SPSS Command Syntax and
Program Blocks along with Error Handling
: Working with SPSS To Create a Graphical
User Interface
Reading Case Data from IBM SPSS Statistics Using
R Program Blocks
IBM SPSS
Comprehensive Beginners Guide to Learn Statistics using IBM SPSS from A-Z
WALKER SCHMIDT
Introduction
We live in a world where information takes on a life of its own and spreads rapidly. Faster than ever before. For some people, their lives depend on obtaining a steady stream of information as it affects their lives in the most telling ways. The daily news is the simplest example of this phenomenon. It is truly the lifeblood of society and helps us evolve into better informed individuals with every passing day.
As one can tell, information on the whole comes at us from every direction. Its influence on business, politics, and government, banking, the STEM fields, and even the social sciences cannot be understated. But its journey begins with raw data being compiled by means of an experiment or study.
From raw data to processed information
Whether it is the crime rate of certain neighbourhoods, the number of accidents each month in a district, the profit and loss of said company each quarter, the English Premier League table standings, or even the chances of a politician winning the election, all of these data points lead us to drawing broader conclusions that affect our lives in the here and now. That said, data is just as useful in academic research too and impacts the kind of medicines we use, the food we eat, the clothes we wear, and the cars we drive. Its literally everywhere.
Data helped us understand why the 2008 financial recession occurred
In fact, it has become so essential to our lives that data analysis and science is now an important field of study that has evolved on its own merit. Now, as most scientists would admit, the information that we receive on a daily basis hinges on obtaining authentic data. In other words, data that is collected, cleaned, analysed, and interpreted accurately. It goes without saying that without a sound framework in place to process data into information, we stand the risk of not being able to make beneficial decisions in every sphere of our lives.
Data Science - the dawn of a new age
This is because data, on its own, does not serve any useful purpose. We, as the researcher, analyst, or scientist, must endeavour to bring it to life.
This begins with using reliable tools and longstanding statistical methods that can help us perform data analysis and interpretation as quickly and accurately as possible. Once we are able to achieve this ideal state of being able to apply the right statistical method to said problem, and are able to obtain results with a powerful tool, we are well on our way to transforming obtained data into trustworthy information.
Data analysis tools arent everything; statistical methods matter too
So, where do we begin?
I think the first step is to immerse ourselves in a world of numbers and methods to process these numbers. Develop a statistical bent-of-mind, as they call it. Of course, this includes collecting both quantitative and qualitative data through the creation of well-designed experiments.
The second step is to learn the use of certain tools that helps us transform data obtained into crucial findings. This is why we will also look at SPSS.
The third is being able to articulate and present our findings and disseminate them to the right audience, which SPSS makes almost effortless.
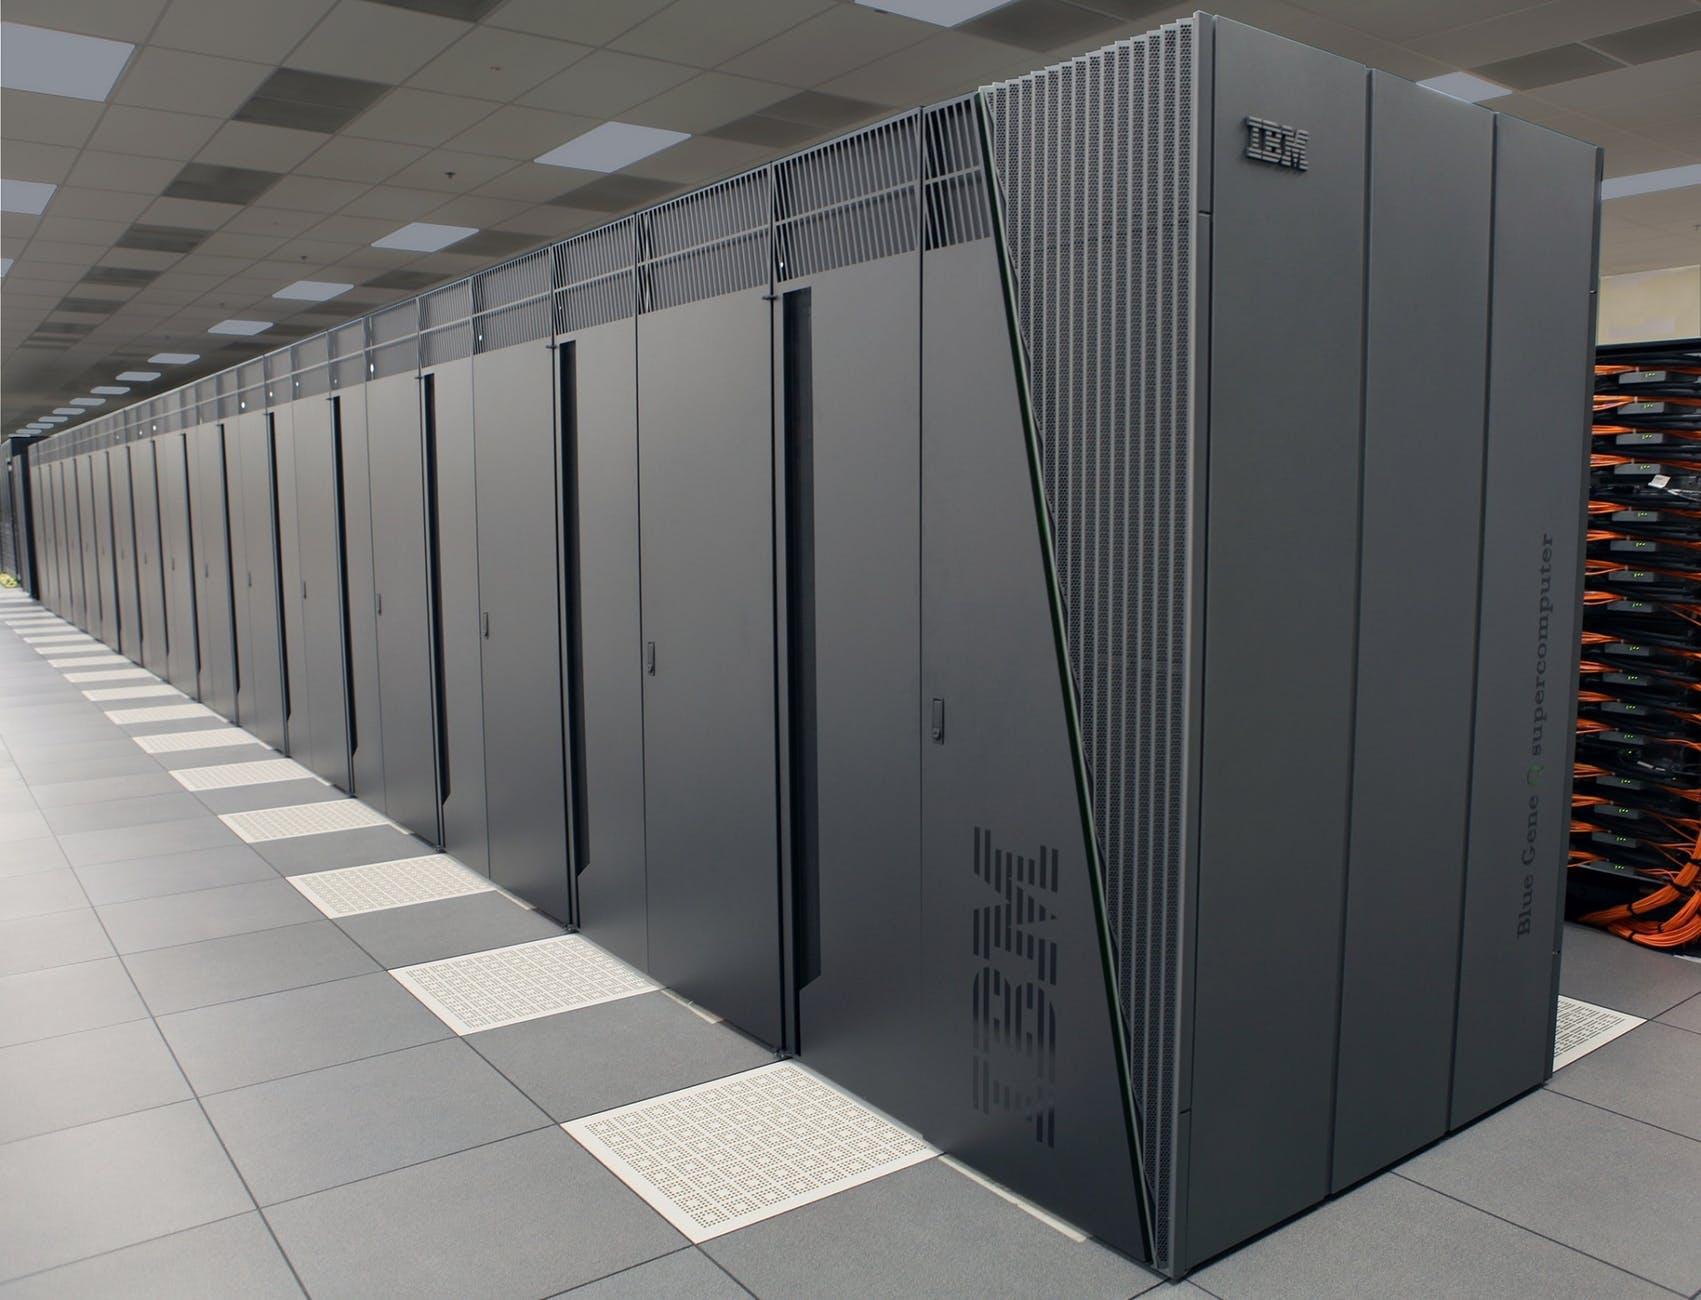
Much like SPSS, Big Blue has been around for a while
That said, in reading the title of this book, youd know that this is exactly what we intend to cover as we look at both the study of statistics and the IBM SPSS tool. Of course, we intend to use a variety of simple datasets that can help us understand how to apply statistical concepts, but we will also get some practice in with the SPSS tool.
But thats not all: not only will you know how to use IBMs SPSS, but you will also understand the reason and the context in which these features are applied to any dataset. In doing so, you should be able to use these features in any situation, provided you are able to determine which statistical method is most conducive to solving a certain problem.
The SPSS Logo, prior to being acquired by IBM in 2010
Given the number of features that this tool has at its disposal, its wise to begin with the absolute basics and gradually build on this foundation as we move from descriptive to inferential statistics. If anything, IBM SPSS has features that go well beyond the topic of descriptive statistics that almost every adult has learned in high school. So, you can imagine the capability that you will possess at your disposal once you have understood how to use this tools features and why. The creators of this package developed this tool for that very purpose.


