Amit Kumar Tyagi - Data Science and Data Analytics
Here you can read online Amit Kumar Tyagi - Data Science and Data Analytics full text of the book (entire story) in english for free. Download pdf and epub, get meaning, cover and reviews about this ebook. year: 2022, publisher: CRC Press (Unlimited), genre: Home and family. Description of the work, (preface) as well as reviews are available. Best literature library LitArk.com created for fans of good reading and offers a wide selection of genres:
Romance novel
Science fiction
Adventure
Detective
Science
History
Home and family
Prose
Art
Politics
Computer
Non-fiction
Religion
Business
Children
Humor
Choose a favorite category and find really read worthwhile books. Enjoy immersion in the world of imagination, feel the emotions of the characters or learn something new for yourself, make an fascinating discovery.

- Book:Data Science and Data Analytics
- Author:
- Publisher:CRC Press (Unlimited)
- Genre:
- Year:2022
- Rating:4 / 5
- Favourites:Add to favourites
- Your mark:
Data Science and Data Analytics: summary, description and annotation
We offer to read an annotation, description, summary or preface (depends on what the author of the book "Data Science and Data Analytics" wrote himself). If you haven't found the necessary information about the book — write in the comments, we will try to find it.
Amit Kumar Tyagi: author's other books
Who wrote Data Science and Data Analytics? Find out the surname, the name of the author of the book and a list of all author's works by series.


![EMC Education Services [EMC Education Services] - Data Science and Big Data Analytics: Discovering, Analyzing, Visualizing and Presenting Data](/uploads/posts/book/119625/thumbs/emc-education-services-emc-education-services.jpg)
Data Science and Data Analytics — read online for free the complete book (whole text) full work
Below is the text of the book, divided by pages. System saving the place of the last page read, allows you to conveniently read the book "Data Science and Data Analytics" online for free, without having to search again every time where you left off. Put a bookmark, and you can go to the page where you finished reading at any time.
Font size:
Interval:
Bookmark:
Sumika Chauhan, Manmohan Singh, and Ashwani Kumar Aggarwal
In the previous few decades, all companies have produced data in large amounts from different sources. It can be from business applications of their own, social media or other web outlets, from smartphones, and client computing devices or from the Internet of Things sensors and software. This knowledge is highly useful for companies that have resources in place to build on it. The overall toolbox for these methods is called data analytics.
Data analytics is used to represent those methods that provide an essential arrangement of the data. It can be classified into four categories, including descriptive, predictive, diagnostic, and prescriptive data analytics. Out of these methods, predictive analytics is the most dynamic approach for data analytics that involves an advanced statistical approach, Artificial Intelligencebased algorithms. Predictive analytics (PA) is the member of advanced analytics that is broadly utilized in the prediction of uncertain future events. A variety of data analysis, statistical modeling, and theoretical approaches are used to bring management, information technology, and business process forecasting together to forecast these predictive events. To define threats and possibilities in the future, the trends contained in historical and transactional data may be used. PA models may track relationships with a complex set of conditions to distribute a score or weighting among several variables to determine risk.
Predictive analytics helps companies to anticipate, construct, and focus on the evidence and not on a hunch or expectations, forecasting findings and actions. The value chain of predictive analytics is seen in .

Figure 1.1 Predictive analytics value chain.
Artificial Intelligence (AI) invokes the simulation of computers based on human intelligence that is designed to think and imitate their behavior like humans. The word can also be extended to any system that shows features similar to a human mind, such as understanding and diagnostic. AI has an outstanding feature that is its capability to rationalize and perform decisions that have the greatest chance of fulfilling a specific target [].
The principle idea behind AI is that it is vital to interpret human intelligence in a manner that a machine can effectively imitate and perform functioning from the easiest to those that are much more complex. The purpose of AI involves comprehension, logic, and interpretation. AI is based on the scenic concept that originally burst, followed later by Machine Learning (ML), and eventually, Deep Learning (DL) that continues to accelerate developments of AI to another level.
From it is observed that there are three concentric circles, DL is a subspace of ML, which is also a subspace of AI.
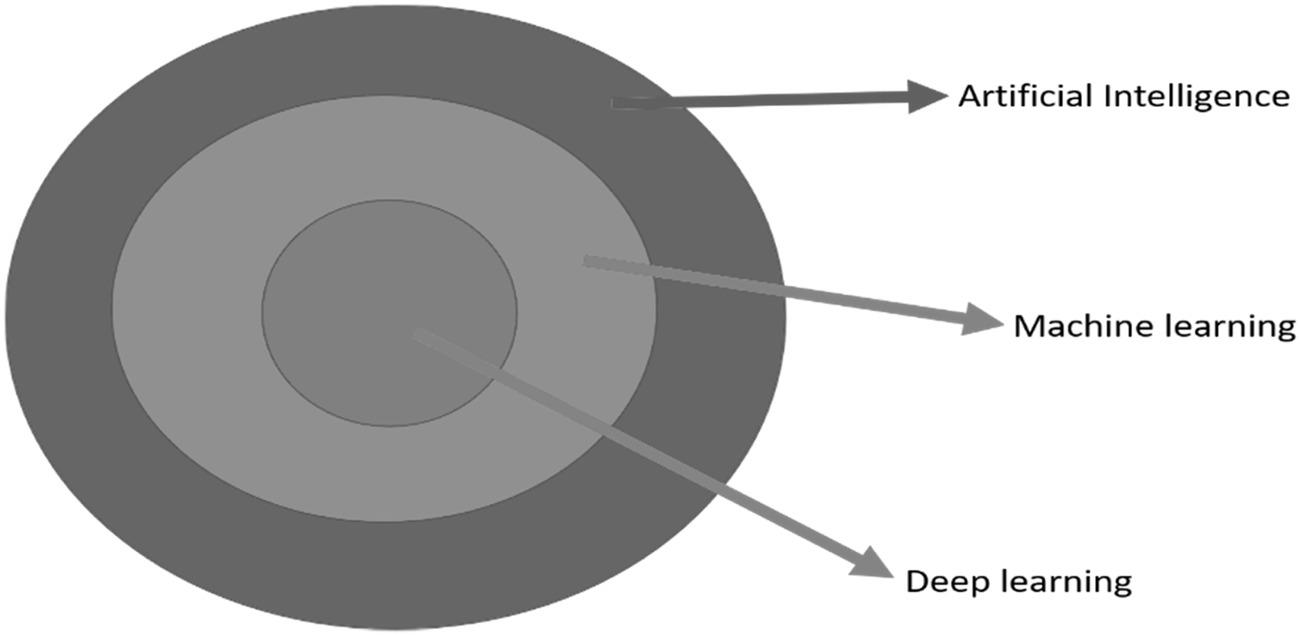
Figure 1.2 Distinction between AI, machine learning, and deep learning.
ML is based on the AI that equips systems with the learning ability and upgrades from experience without being programmed directly. It can be categorized in supervised learning, unsupervised learning, and reinforcement.
Supervised learning is the assignment for ML to learn an operation that outlines a vector input to an output vector, based on the I/O relationship. Classification is the method of foreseeing the class or labels of given datasets. Classification forecast methodology is the duty of estimating mapping operation from input variables to distinct output variables. Basically, the methods for supervised learning are classified into two categories: regression and classification.
Regression is the most powerful statistical method in data analytics that pursues to describe the power and aspects of the relationship between one dependent variable to a series of other independent variables. Various types of regression are available in the literature []. A few of them are discussed as follows.
It attempts to relate the two features by fitting a linear relation with corresponding estimated regression parameters. One variable is taken as an explanatory vector, and the second one is considered as a vulnerable vector. The linear regression is used in cost prediction and estimation of some data analysis in the data analytics. Let us consider a sample of N objects with m variables, which can be represented as Nm matrix X and the predicted output is a vector YT=(y1,y2,,ym). For a particular individual i, let Xi=xi1,xi2,,xim, which indicates the covariate vector. The output is a continuous variable denoted by Yi. Mathematically linear regression is given as
yi=0+j=1mxijjy (1.1)
The 0 indicates the intercept and is also called the bias in machine learning, and T=(1,2,,m) is the coefficient vector. The values of all input variates should be numeric for the feasible computation of the covariate values. The equation can be rewritten as
Y=XT (1.2)
Parameter estimation is considered as minimization of loss function over a dataset in the supervised learning. The least-squares approach is the commonly used technique for an appropriate regression line. In this method, the calculation of the best-fitting line is accomplished using observed data to minimize the sum of the square of the vertical deviations from each data point. The cost function is defined in terms of residual sum of squares, which is computed using Euclidean distance between the measured and projected outputs, Y. This can be written mathematically as
RSS=i=1NyixiT2 (1.3)
RSS represent the quadratic operation of the parameters; thus, the minimum value of it is always present. The solution is easily obtained in matrix representation, written as
RSS=yXTyX (1.4)
The minimization of the above-mentioned equation can be obtained by setting the first derivative of RSS equal to zero. Differentiating w.r.t. , the obtained normal equation is given as
XTyX=0 (1.5)
If XTX is non-singular, then a unique solution is obtained by
=XTX1XTy (1.6)
and obtained value, which is fitted at the ith input xi, is yi=yxi=xiT. At an arbitrary input x0, the prediction is yx0=x0T.
Logistic regression searches for the relationship between an unambiguous dependent variable and a number of autonomous (explainable) variables. It is a binary classification technique. The dependent variables have only two values, such as 0 or 1, or these variables are the binary type. The probabilitys log-odds and feature share a linear relation. For a convinced particle Xi=xi1,xi2,,xim, the predicted output yi can be labeled as either 0 or 1. The equation of the logistic regression is given as
logPryi=1|XiPryi=0|Xi=k=0mxikk=Xi (1.7)
The value of xi0 is 1 and represents the intercept. As we know that in the case of two-class classification Pryi=1|Xi+Pryi=0|Xi=1; thus, from equation (1.7) we have
Pryi=1|Xi=expXi1+expXi (1.8)
The parameter estimation is accomplished by maximizing the cost function in the logistic regression models. The joint conditional probability for all N points in training data is
Pr(y=y1|X1)Pr(y=y2|X2).....Pr(y=yN|XN)=i=1NPr(y=yi|Xi) (1.9)
where yi;i=1,2,,N is the predicted labels in the training set. The log-likelihood for N observations is
()=i=1Nlog[(Pr(y=yi)|Xi)] (1.10)
where the logit transformation of conditional probability for an individual Xi is
log[(Pr(y=yi)|Xi)]={Xilog[1+exp(Xi)]:yi=1log[1+exp(Xi)]:yi=0 (1.11)
Font size:
Interval:
Bookmark:
Similar books «Data Science and Data Analytics»
Look at similar books to Data Science and Data Analytics. We have selected literature similar in name and meaning in the hope of providing readers with more options to find new, interesting, not yet read works.
Discussion, reviews of the book Data Science and Data Analytics and just readers' own opinions. Leave your comments, write what you think about the work, its meaning or the main characters. Specify what exactly you liked and what you didn't like, and why you think so.