Founded in 1807, John Wiley & Sons is the oldest independent publishing company in the United States. With offices in North America, Europe, Australia, and Asia, Wiley is globally committed to developing and marketing print and electronic products and services for our customers' professional and personal knowledge and understanding.
The Wiley Trading series features books by traders who have survived the markets ever changing temperament and have prosperedsome by reinventing systems, others by getting back to basics. Whether a novice trader, professional, or somewhere in-between, these books will provide the advice and strategies needed to prosper today and well into the future.
For a list of available titles, visit our web site at www.WileyFinance.com .
Copyright 2012 by Guy Cohen. All rights reserved.
Published by John Wiley & Sons, Inc., Hoboken, New Jersey.
Published simultaneously in Canada.
No part of this publication may be reproduced, stored in a retrieval system, or transmitted in any form or by any means, electronic, mechanical, photocopying, recording, scanning, or otherwise, except as permitted under Section 107 or 108 of the 1976 United States Copyright Act, without either the prior written permission of the Publisher, or authorization through payment of the appropriate per-copy fee to the Copyright Clearance Center, Inc., 222 Rosewood Drive, Danvers, MA 01923, (978) 750,8400, fax (978) 6468600, or on the Web at www.copyright.com . Requests to the Publisher for permission should be addressed to the Permissions Department, John Wiley & Sons, Inc., 111 River Street, Hoboken, NJ 07030, (201) 7486011, fax (201) 7486008, or online at www.wiley.com/go/permissions .
Limit of Liability/Disclaimer of Warranty: While the publisher and author have used their best efforts in preparing this book, they make no representations or warranties with respect to the accuracy or completeness of the contents of this book and specifically disclaim any implied warranties of merchantability or fitness for a particular purpose. No warranty may be created or extended by sales representatives or written sales materials. The advice and strategies contained herein may not be suitable for your situation. You should consult with a professional where appropriate. Neither the publisher nor author shall be liable for any loss of profit or any other commercial damages, including but not limited to special, incidental, consequential, or other damages.
For general information on our other products and services or for technical support, please contact our Customer Care Department within the United States at (800) 7622974, outside the United States at (317) 5723993 or fax (317) 5724002.
Wiley also publishes its books in a variety of electronic formats. Some content that appears in print may not be available in electronic books. For more information about Wiley products, visit our web site at www.wiley.com .
Library of Congress Cataloging-in-Publication Data:
Cohen, Guy.
The insider edge : how to follow the insiders for windfall profits / Guy Cohen. 1st ed.
p. cm. (Wiley trading ; 582)
Includes index.
ISBN 978-1-118-24528-6 (hardcover); ISBN 978-1-118-28484-1 (ebk); ISBN 978-1-118-28434-6 (ebk); ISBN 978-1-118-28255-7 (ebk)
1. Stocks. 2. Profit. I. Title.
HG4661.C595 2012
332.63dc23
2012015372
Preface
Between January 1, 2008 and February 28, 2008, Bear Stearns (BSC) shares traded in a range between $68.18 and $93.09.
On March 3, 2008, Bear Stearns closed at $77.32 (see ). At around this time most commentators (famously including those on CNBC) were suggesting that BSC could be a takeover target and, as such, were bullish on the stock's prospects.
BSC March 3, 2008 Chart
Source: OVI Charts. Courtesy of FlagTrader.com . Go to www.theinsideredge.com for more information.
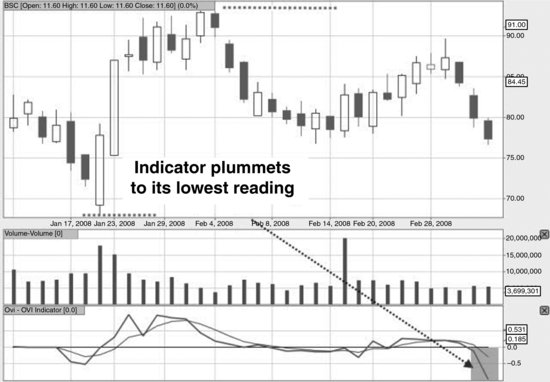
At the same time, an unknown new indicator plummeted to its lowest possible reading for BSC. In itself that wasn't the key factor. It's the fact that for the next two weeks the indicator remained at its most negative reading for all but two days.
Exactly two weeks after the unknown indicator plummeted, BSC went into free-fall, reaching a low of $2.84. Bear Stearns was indeed taken over, but at $10 per share, a far cry from the heady heights of $77.32 (see ).
BSC March 17, 2008 Chart
Source: OVI Charts. Courtesy of FlagTrader.com . Go to www.theinsideredge.com for more information.
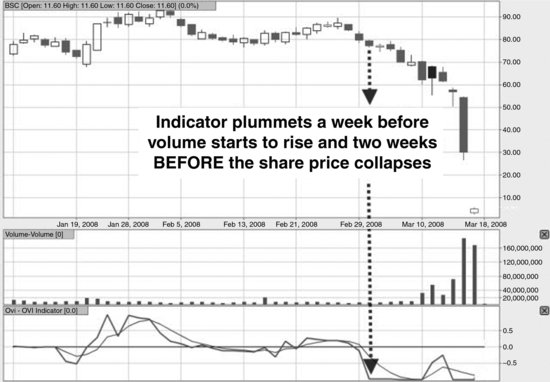
This was one of the most dramatic declines in the history of the stock market, and yet not one commentator saw it coming.
And yet, there were people who DID see it comingand they made a fortune from it, too.
How do we know this? Well, the unknown indicator measures options transactions for individual stocks. And in the case of BSC, the indicator went crazy to the downside two weeks before BSC collapsed!
Someone, somewhere knew something
In this book you're going to learn how to spot another Bear Stearns, or, more positively, how to spot a meteoric rise in a stock before it happens. The unknown indicator is now unveiled.
Whatever your trading experience or proficiency may be, this book is for you, provided you want to make money in the markets.
That's a pretty bold statement, but the reason this book is for you, regardless of your prior experience, is because the method within is effective, simple, and easy to apply.
This is music to the ears of anyone who just wants to make money from the markets. It doesn't matter what your proficiency is; we all want a time-efficient way to make money from the markets, and this book delivers exactly that.
I should also emphasize that this is not a book on options! We will refer to options because part of our method relies on following what the savvy options traders are doing, but this is specifically not an options book.
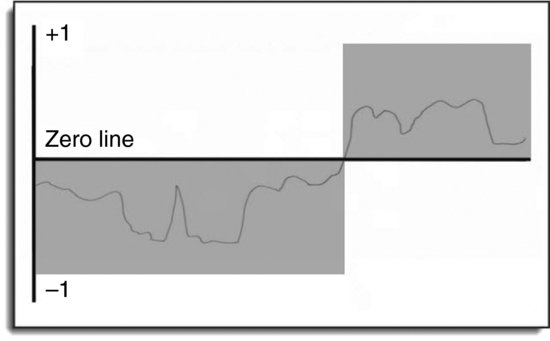
The way we do this is by following a simple indicator that is derived from options transaction data. See the diagram in . If you can identify where this line is positive (above the horizontal line) or negative (below the horizontal line), then you qualify. It's that simple!
OVI Simple Line
The basic premise of this book is as follows:

What you'll discover during the book is what chart pattern, what indicator, and how to implement the trading plan.
The uniqueness of this book resides with the special indicator (the OVI), which is derived from options transactions data. We're basically going to follow what the savviest traders in the market are doing. We stick to a simple chart pattern to improve our odds further, and we implement a safe trading plan that enables us to make windfall profits if a trend develops.
So, what exactly is the OVI?
Well, it's an indicator that oscillates between 1 and +1. When it's positive (and there's a corresponding chart pattern) then we focus on buying opportunities. When it's negative (and there's a corresponding chart pattern) we focus on shorting opportunities.






![Ryan Mallory [Ryan Mallory] - The Part-Time Trader: Trading Stock as a Part-Time Venture, + Website](/uploads/posts/book/124134/thumbs/ryan-mallory-ryan-mallory-the-part-time-trader.jpg)
