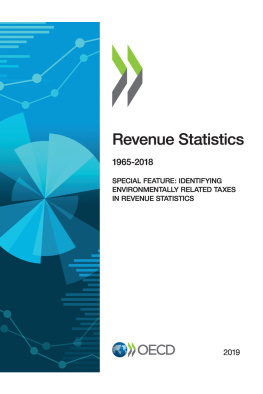
OECD - Revenue Statistics 2019
Here you can read online OECD - Revenue Statistics 2019 full text of the book (entire story) in english for free. Download pdf and epub, get meaning, cover and reviews about this ebook. year: 2019, publisher: OECD Publishing, genre: Politics. Description of the work, (preface) as well as reviews are available. Best literature library LitArk.com created for fans of good reading and offers a wide selection of genres:
Romance novel
Science fiction
Adventure
Detective
Science
History
Home and family
Prose
Art
Politics
Computer
Non-fiction
Religion
Business
Children
Humor
Choose a favorite category and find really read worthwhile books. Enjoy immersion in the world of imagination, feel the emotions of the characters or learn something new for yourself, make an fascinating discovery.
Revenue Statistics 2019: summary, description and annotation
We offer to read an annotation, description, summary or preface (depends on what the author of the book "Revenue Statistics 2019" wrote himself). If you haven't found the necessary information about the book — write in the comments, we will try to find it.
OECD: author's other books
Who wrote Revenue Statistics 2019? Find out the surname, the name of the author of the book and a list of all author's works by series.
Revenue Statistics 2019 — read online for free the complete book (whole text) full work
Below is the text of the book, divided by pages. System saving the place of the last page read, allows you to conveniently read the book "Revenue Statistics 2019" online for free, without having to search again every time where you left off. Put a bookmark, and you can go to the page where you finished reading at any time.
Font size:
Interval:
Bookmark:
OECD (2019), Revenue Statistics 2019 , OECD Publishing, Paris, https://doi.org/10.1787/0bbc27da-en .
This annual publication provides information on tax levels and tax structures in OECD countries. It was prepared under the auspices of the Working Party on Tax Policy Analysis and Tax Statistics of the Committee on Fiscal Affairs and is published under the responsibility of the Secretary-General of the OECD.
Revenue Statistics 2019 has been produced by the Organisation for Economic Cooperation and Development (OECD)s Centre for Tax Policy and Administration (CTPA) under the auspices of Working Party No.2 on Tax Policy Analysis and Tax Statistics (WP2) of the Committee on Fiscal Affairs. The authors of this edition were Michelle Harding, Nicols Miranda and Michael Sharratt. The special feature was written by Miguel Crdenas Rodrguez and Ivan Hai in the Environment Directorate and by Michelle Harding.
The authors would like to thank colleagues in the OECD for their invaluable comments and practical support in finalising the publication, including David Bradbury, Karena Garnier, Natalie Lagorce, and Violet Sochay in CTPA; Frederic Parrot and Bettina Wistrom in the Statistics and Data Directorate and the Statistical Editors and Content Management Team in the Press and Communications Directorate. Marie-Aurlie Elkurd at CTPA assisted with the production and publication of this report and Stephanie Coic in the Development Cooperation Directorate (DCD) designed the cover. The authors would also like to thank WP2 delegates and their colleagues working in national administrations for their input and comments.
In 2018, the average OECD tax-to-GDP ratio remained virtually unchanged compared to 2017, with almost no increase (a change of 0.02 percentage points). This ends the trend of annual increases in the OECD average tax-to-GDP ratio observed since 2009, following the financial crisis. The slowing in the growth of the OECD average was predominantly driven by the impact of the significant fall in the tax-to-GDP ratio of the United States as a result of their tax reforms. However, due to rounding the OECD average tax-to-GDP ratio was 34.3% in 2018 compared to 34.2% in 2017.
In this publication, taxes are defined as compulsory, unrequited payments to general government. They are unrequited in that the benefits provided by governments to taxpayers are not normally allocated in proportion to their payments. Taxes are classified by their base: income, profits and capital gains; payroll; property; goods and services; and other taxes. Compulsory social security contributions (SSCs) paid to general government are also treated as taxes. Revenues are analysed by level of government: federal or central; state; local; and social security funds. Detailed information on the classifications applied is set out in the Interpretative Guide in Annex A.
Across OECD countries, tax-to-GDP ratios in 2018 ranged from 16.1% in Mexico to 46.1% in France. Half of the OECD countries had tax-to-GDP ratios between 32% and 40% of GDP in 2018, with one-quarter of countries having ratios above this level and one-quarter below. Between 2017 and 2018, the OECD average tax-to-GDP ratio remained virtually unchanged (a change of 0.02 percentage points), although due to rounding the headline figures increased from 34.2% (34.24%) to 34.3% (34.26%).
An increase in tax-to-GDP ratios from 2017 to 2018 is observed in 19 of the 34 countries for which preliminary 2018 data is available. In all of these countries, the increase was due to nominal tax revenues increasing more than the nominal increase in GDP. The increase in the tax-to-GDP ratio was largest in Korea and Luxembourg (1.5 and 1.3 percentage points, respectively) due to higher corporate income taxes in both countries as well as higher revenues from personal income taxes in Luxembourg. There were no other increases above one percentage point.
Fifteen countries experienced a decrease in tax-to-GDP ratios in 2018 relative to 2017. The largest fall was seen in the United States (2.5 percentage points), following the reforms to corporate and personal income taxes and the one-off repatriation tax on foreign earnings implemented in the Tax Cuts and Jobs Act. Falls of over one percentage points were also observed in Hungary and Israel (1.6 and 1.4 percentage points, respectively). Smaller decreases were seen in Denmark, Finland, France, Greece, Iceland, Ireland, Italy, Latvia, the Slovak Republic, Sweden, Switzerland and Turkey. In most countries the decreases were due to nominal tax revenues increasing by less than the increase in GDP, except in the United States and Israel, where nominal tax revenues fell relative to 2017, but nominal GDP rose.
Across the last decade, 26 OECD countries reported higher tax-to-GDP ratios in 2018 than in 2008, with the greatest increases in Greece and the Slovak Republic. Among the remaining 10 countries, tax levels in 2018 remained more than six percentage points lower in Ireland and more than two percentage points lower in Hungary and Norway.
In 2017, the latest year in which final data is available for all countries, social security contributions (SSCs) amounted to the largest share of tax revenues in the OECD, at just over one-quarter (26.0%) of total revenues, and together with personal income taxes (23.9%) the two categories amounted to nearly one-half of tax revenues in OECD countries, on average. Value Added Tax (VAT) accounted for a further one-fifth of total revenues (20.2%). Other consumption taxes and taxes on corporate income accounted for smaller shares of tax revenues (12.2% and 9.3% respectively), with property taxes (5.8%) and residual taxes accounting for the remaining share.
Since 2016, the share of income taxes to total revenue has increased by 0.7 percentage points. This was relatively evenly split between personal and corporate income taxes (0.4 and 0.3 percentage points, respectively). This continues the recent increase in the share of corporate tax revenues, from 8.8% of total tax revenues in 2014 and 2015, to 9.0% in 2016 and 9.3% in 2017. Since 2016, the share of revenues from taxes on goods and services decreased slightly, with an increase in VAT revenues of 0.2 percentage points outweighed by a fall in the share of revenues from other goods and services taxes (0.3 percentage points). The largest fall between 2016 and 2017 was seen in property tax revenues (0.7 percentage points) although this reflects the impact of the one-off stability contributions in Iceland, which had increased their share in 2016.
Font size:
Interval:
Bookmark:
Similar books «Revenue Statistics 2019»
Look at similar books to Revenue Statistics 2019. We have selected literature similar in name and meaning in the hope of providing readers with more options to find new, interesting, not yet read works.
Discussion, reviews of the book Revenue Statistics 2019 and just readers' own opinions. Leave your comments, write what you think about the work, its meaning or the main characters. Specify what exactly you liked and what you didn't like, and why you think so.

