1. Introduction to Enterprise Data Lakes
In God, we Trust; all others must bring data
W. Edwards Deming , a statistician who devised Plan-Do-Study-Act method
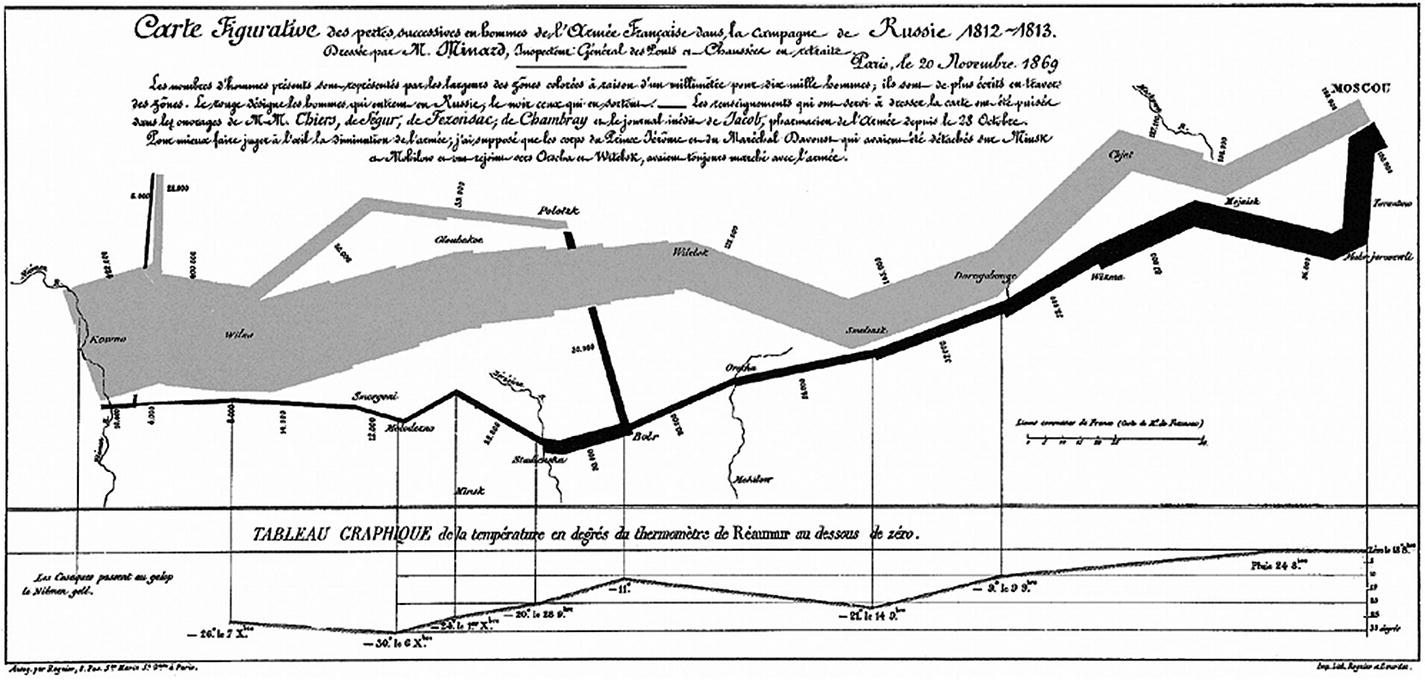
It was in 1861 when Charles Joseph Minard, an 80-year-old French civil engineer, attempted to develop a visual that can narrate Napoleons disastrous Russian campaign of 1812. Figure depicts people movement and exhibits details on geography, time, temperature, troop count, course, and direction.
Figure 1-1
Minards map of Napoleans russing campaign in 1812 Source: Worth a thousand words: A good graphic can tell a story, bring a lump to the throat, even change policies. Here are three of historys best. The Economist, December 19, 2007, https://www.economist.com/node/10278643 .
From the above chart, in 1812, the Grand Army consisted of 422,000 personnel started from Poland; out of which only 100,000 reached Moscow and 10,000 returned. The French community describes the tragedy as Cest la Brzina.
The chart depicts the tragic tale with such clarity and precision. The quality of the graph is accredited to the data analysis from Minard and a variety of factors soaked in to produce high-quality map. It remains one of the best examples of statistical visualization and data storytelling to date. Many analysts have spent ample time to analyze through Minards map and prognosticated the steps he must have gone through before painting a single image, though painful, of the entire tragedy.
Data analysis is not new in the information industry. What has grown over the years is the data and the expectation and demand to churn gold out of data. It would be an understatement to say that data has brought nothing but a state of confusion in the industry. At times, data gets unreasonable hype, though justified, by drawing an analogy with currency, oil, and everything precious on this planet.
Approximately two decades ago, data was a vaporous component of the information industry. All data used to exist raw, and was consumed raw, while its crude format remained unanalyzed. Back then, the dynamics of data extraction and storage were dignified areas that always posed challenges for enterprises. It all started with business-driven thoughts like variety, availability, scalability, and performance of data when companies started loving data. They were mindful of the fact that at some point, they need to come out of relational world and face the real challenge of data management. This was one of the biggest information revolutions that web 2.0 companies came across.
The information industry loves new trends provided they focus on business outcomes, catchy and exciting in learning terms, and largely uncovered. Big data picked up such a trend that organizations seemed to be in a rush to throw themselves under the bus, but failed miserably to formulate the strategy to handle data volume or variety that could potentially contribute in meaningful terms. The industry had a term for something that contained data : data warehouse, marts, reservoirs, or lakes. This created a lot of confusion but many prudent organizations were ready to take bets on data analytics.
Data explosion: the beginning
Data explosion was something that companies used to hear but never questioned their ability to handle it. Data was merely used to maintain a system of record of an event. However, multiple studies discussed the potential of data in decision making and business development. Quotes like Data is the new currency and Data is the new oil of Digital Economy struck headlines and urged many companies to classify data as a corporate asset.
Research provided tremendous value hidden in data that can give deep insight in decision making and business development. Almost every action within a digital ecosystem is data-related, that is, it either consumes or generates data in a structured or unstructured format. This data needs to be analyzed promptly to distill nuggets of information that can help enterprises grow.
So, what is Big Data? Is it bigger than expected? Well, the best way to define Big Data is to understand what traditional data is. When you are fully aware of data size, format, rate at which it is generated, and target value, datasets appear to be traditional and manageable with relational approaches. What if you are not familiar with what is coming? One doesnt know the data volume, structure , rate, and change factor. It could be structured or unstructured, in kilobytes or gigabytes, or even more. In addition, you are aware of the value that this data brings. This paradigm of data is capped as Big Data IT. Major areas that distinguish traditional datasets from big data ones are Volume, Velocity, and Variety . Big is rather a relative measure, so do the three V areas. Data volume may differ by industry and use case. In addition to the three Vs, there are two more recent additions: Value and Veracity. Most of the time, the value that big data carries cannot be measured in units. Its true potential can be weighed only by the fact that it empowers business to make precise decisions and translates into positive business benefits. The best way to gauge ROI would be to compare big data investments against the business impact that it creates. Veracity refers to the accuracy of data. In the early stages of big data project lifecycle, quality, and accuracy of data matters to a certain extent but not entirely because the focus is on stability and scalability instead of quality. With the maturity of the ecosystem and solution stack, more and more analytical models consume big data and BI applications report insights, thereby instigating a fair idea about data quality. Based on this measure, data quality can be acted upon.
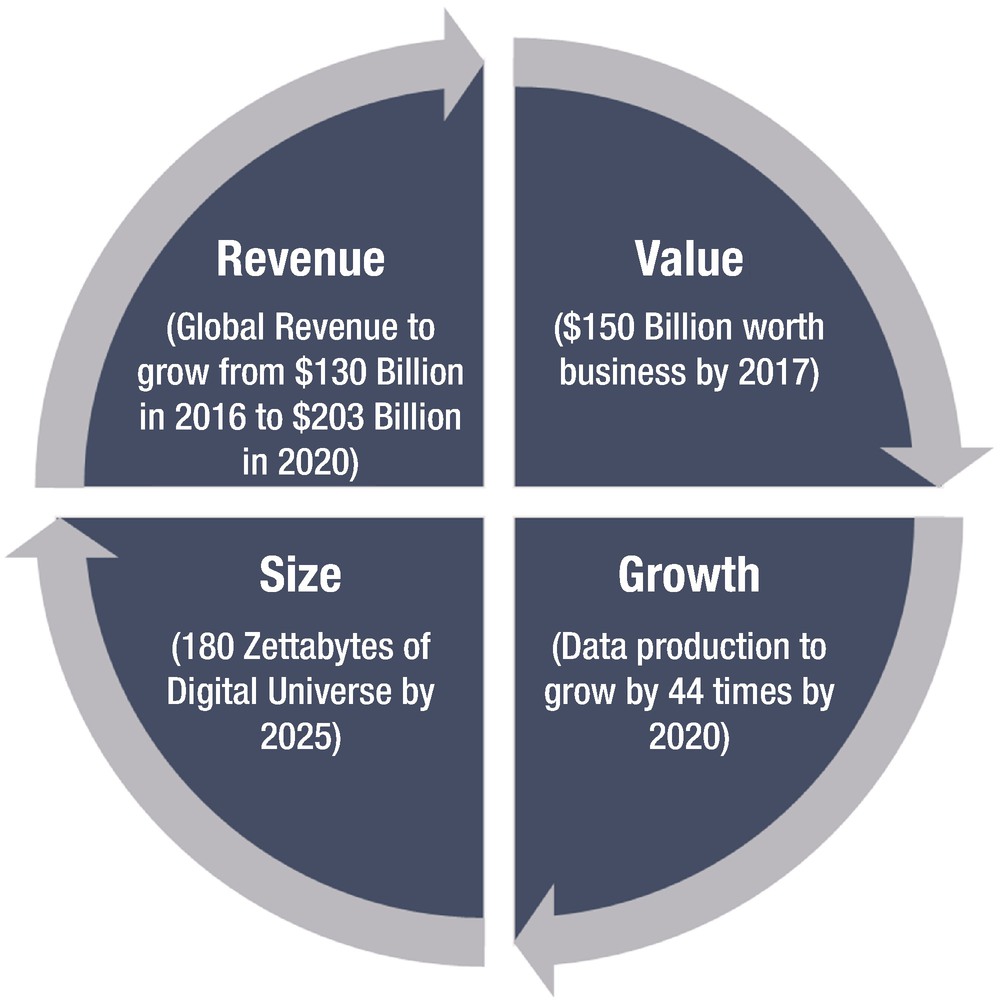
Let us have a quick look at the top Big Data trends in 2017 (Figure ).
Figure 1-2
Top big data trends in 2017. Source: Data from Double-Digit Growth Forecast for the Worldwide Big Data and Business Analytics Market Through 2020 Led by Banking and Manufacturing Investments, According to IDC, International Data Corporation (IDC), October, 2016, https://www.idc.com/getdoc.jsp?containerId=prUS41826116 .
The top facts and predictions about Big Data in 2017 are:
Per IDC, worldwide revenues for big data and business analytics (BDA) will grow from $130.1 billion in 2016 to more than $203 billion in 2020.
Per IDC, the Digital Universe estimated is to grow to 180 Zettabytes by 2025 from pre-estimated 44 Zettabytes in 2020 and from less than 10 Zettabytes in 2015.
Traditional data is estimated to fold by 2.3 times between 2020 and 2025. In the same span of time, analyzable data will grow by 4.8 times and actionable data will grow by 9.6 times.
Data acumen continues to be a challenge. Organization alignment and a management mindset are found to be more business centric than data centric .
Technologies like Big Data, Internet of Things, data streaming, business intelligence, and cloud will converge to become a much more robust data management package. Cloud-based analytics to play key role in accelerating the adoption of big data analytics.

