• Complain

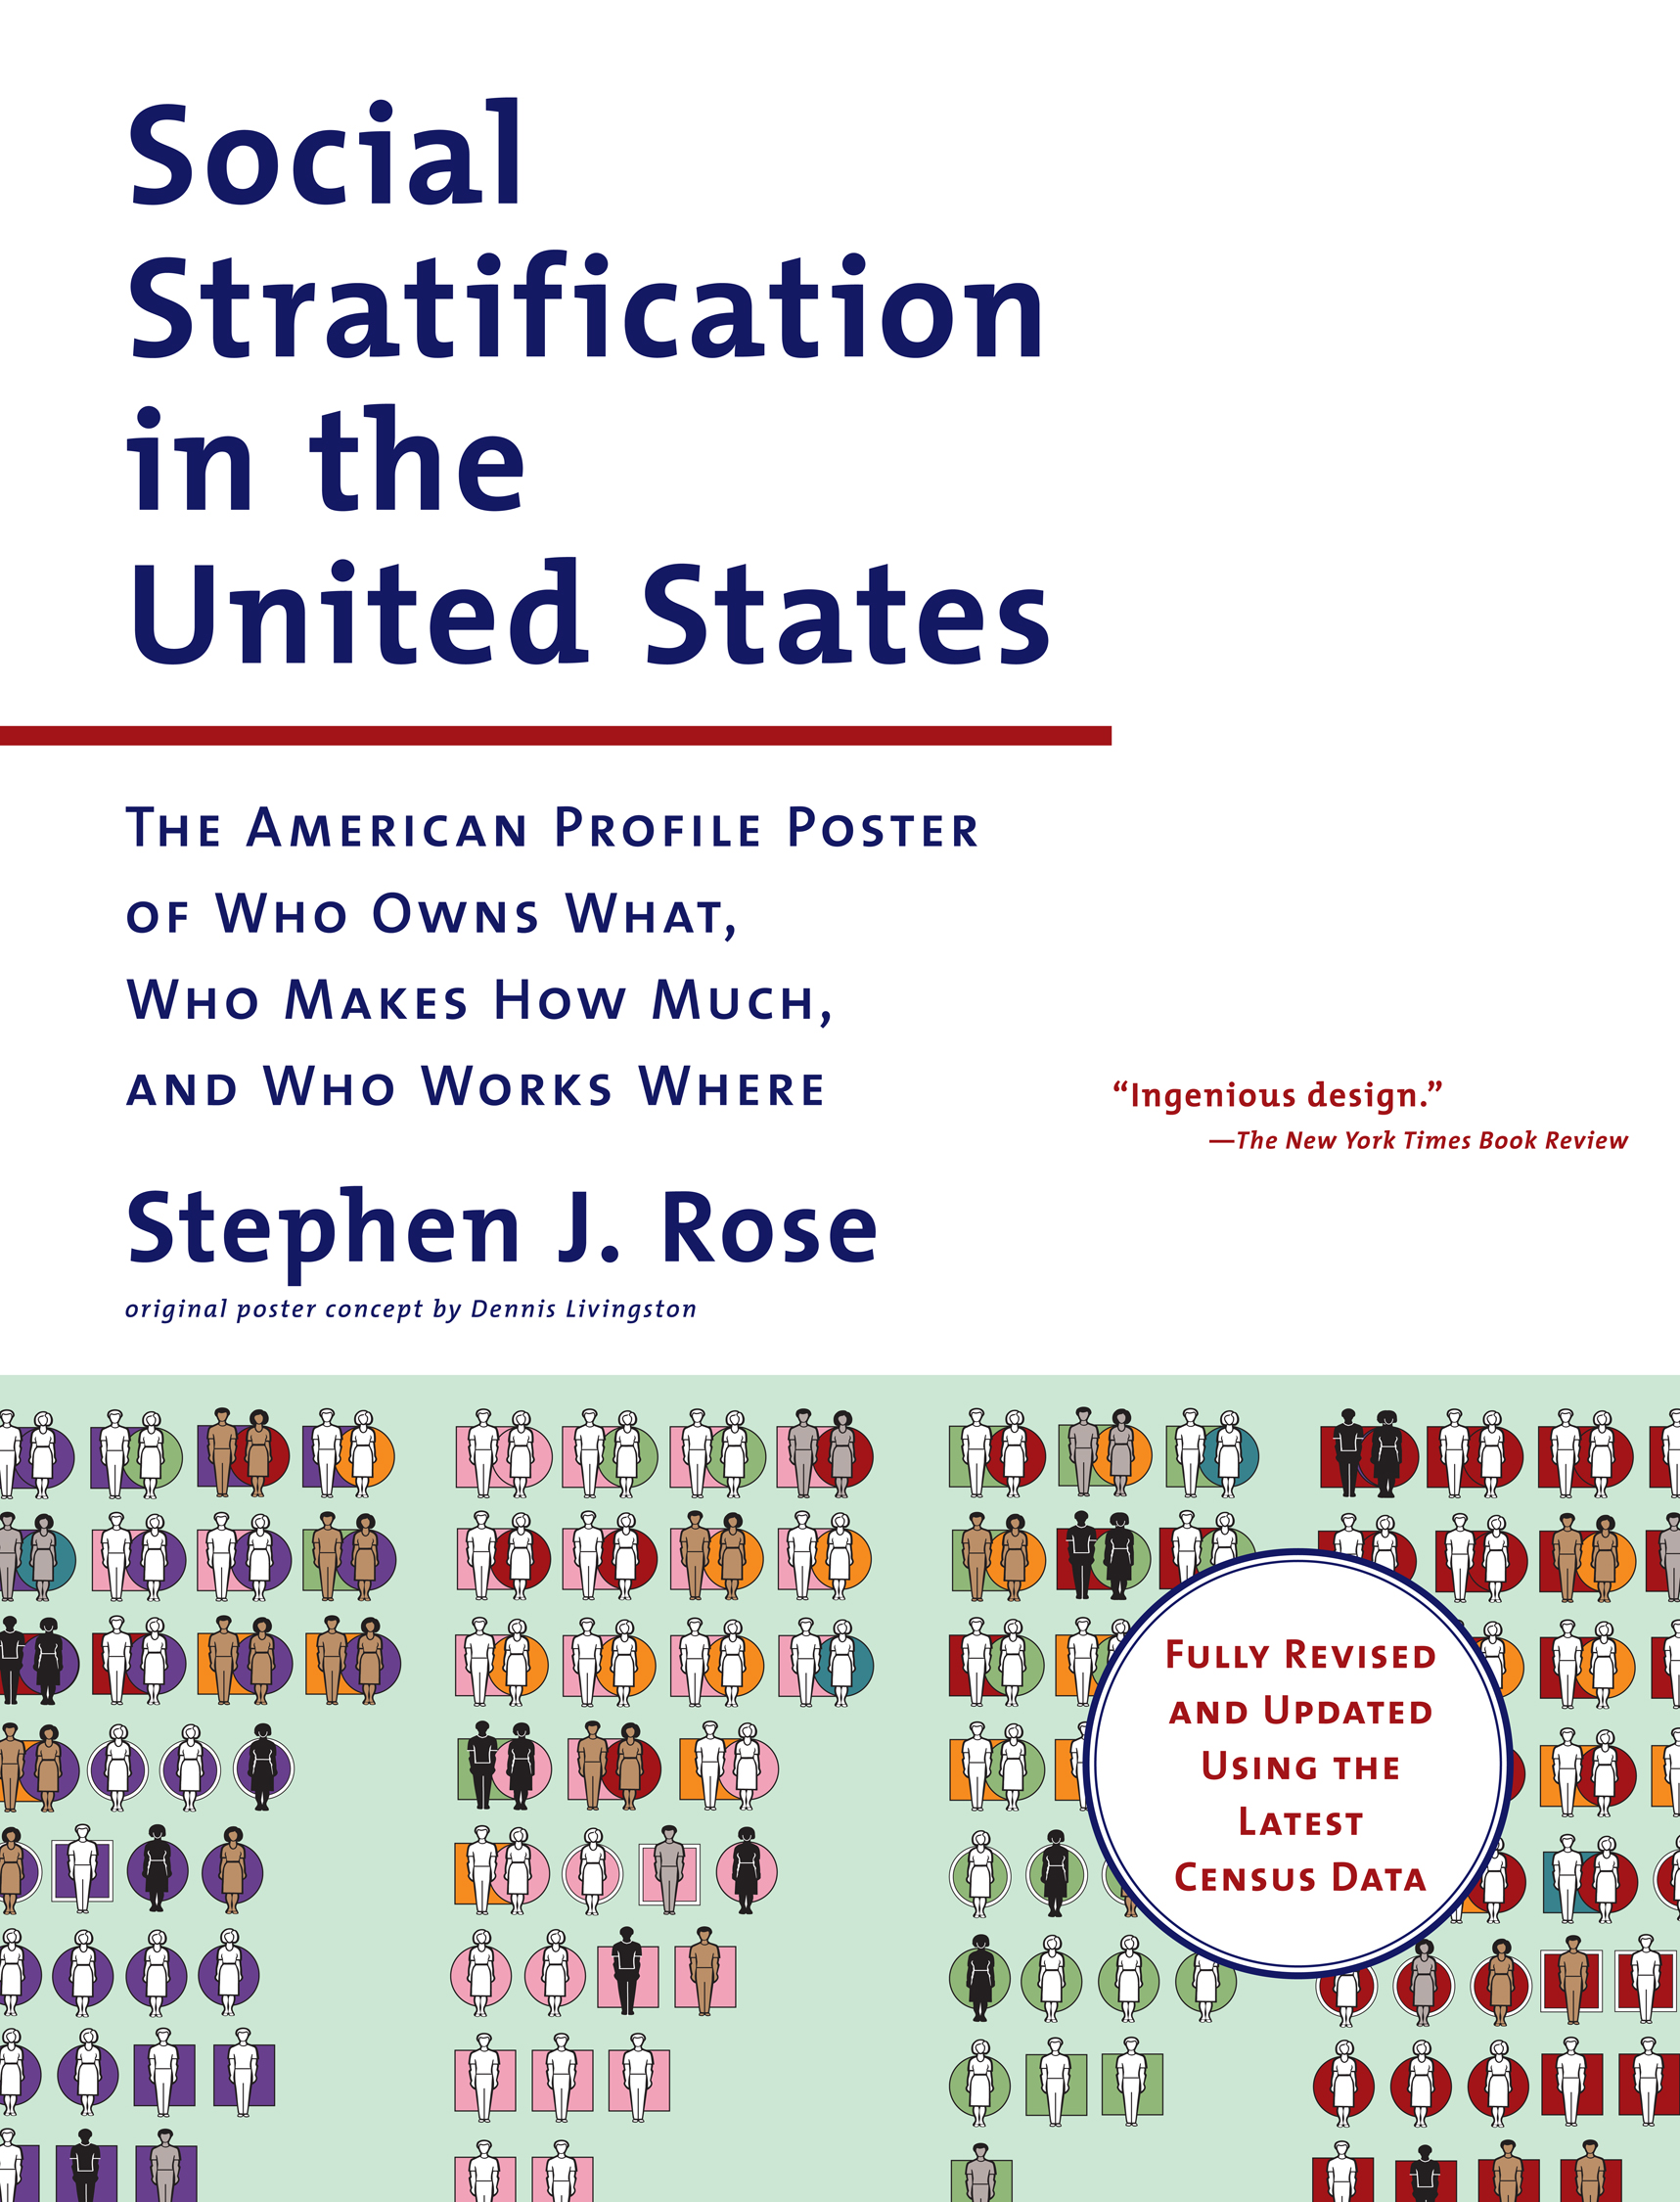
Stephen J. Rose - Social Stratification in the United States: The American Profile Poster of Who Owns What, Who Makes How Much, and Who Works Where

Here you can read online Stephen J. Rose - Social Stratification in the United States: The American Profile Poster of Who Owns What, Who Makes How Much, and Who Works Where full text of the book (entire story) in english for free. Download pdf and epub, get meaning, cover and reviews about this ebook. year: 2022, publisher: The New Press, genre: Politics. Description of the work, (preface) as well as reviews are available. Best literature library LitArk.com created for fans of good reading and offers a wide selection of genres:

Romance novel Science fiction Adventure Detective Science History Home and family Prose Art Politics Computer Non-fiction Religion Business Children Humor

Choose a favorite category and find really read worthwhile books. Enjoy immersion in the world of imagination, feel the emotions of the characters or learn something new for yourself, make an fascinating discovery.

No cover
  • Book:
    Social Stratification in the United States: The American Profile Poster of Who Owns What, Who Makes How Much, and Who Works Where
  • Author:
  • Publisher:
    The New Press
  • Genre:
  • Year:
    2022
  • Rating:
    5 / 5
  • Favourites:
    Add to favourites
  • Your mark:
    • 100
    • 1
    • 2
    • 3
    • 4
    • 5

Social Stratification in the United States: The American Profile Poster of Who Owns What, Who Makes How Much, and Who Works Where: summary, description and annotation

We offer to read an annotation, description, summary or preface (depends on what the author of the book "Social Stratification in the United States: The American Profile Poster of Who Owns What, Who Makes How Much, and Who Works Where" wrote himself). If you haven't found the necessary information about the book — write in the comments, we will try to find it.

The must-have new edition of the classic book-and-poster set, based on the most recent census data, depicting who owns what, who makes how much, who works where, and who lives with whom

Generations of teachers, union organizers, and activists have relied on this book-and-poster set, originally published in 1979, to illustrate the magnitude of Americas growing economic divide. Today, income inequality is at an all-time high, and this completely updated eighth edition, drawn from the 2020 Current Population Survey of the U.S. Census, brings together fresh primary data to provide a clear picture of the U.S. social structure and the considerable demographic and economic changes of the past four decades.

Folded inside the companion booklet, the removable poster depicts color-coded figures that make it possible to compare social groups at a glance and to understand how income distribution relates to race, sex, education, and occupation. With charts and careful explanations, the booklet contextualizes and expands on the poster.

Roses graphic depiction of the census data makes clear at a glance complex concepts, including the way recent economic growth has been skewed toward the wealthiest households, that a gender gap persists in the workplace, and that, on average, African Americans and Latinos still earn far less than other Americans. This new edition of a uniquely visual depiction of American society will be an essential resource and a touchstone for the current debates over education, inequality, poverty, and jobs in our country.

Stephen J. Rose: author's other books


Who wrote Social Stratification in the United States: The American Profile Poster of Who Owns What, Who Makes How Much, and Who Works Where? Find out the surname, the name of the author of the book and a list of all author's works by series.

Social Stratification in the United States: The American Profile Poster of Who Owns What, Who Makes How Much, and Who Works Where — read online for free the complete book (whole text) full work

Below is the text of the book, divided by pages. System saving the place of the last page read, allows you to conveniently read the book "Social Stratification in the United States: The American Profile Poster of Who Owns What, Who Makes How Much, and Who Works Where" online for free, without having to search again every time where you left off. Put a bookmark, and you can go to the page where you finished reading at any time.

Light

Font size:

Reset

Interval:

Bookmark:

Make
Contents
List of Figures
List of Tables
Guide
Pagebreaks of the Print Version
STEPHEN J ROSE is a nationally recognized labor economist Currently he is a - photo 1

STEPHEN J. ROSE is a nationally recognized labor economist. Currently, he is a research professor at the George Washington Institute of Public Policy and a nonresident fellow at the Urban Institute. He previously held senior positions at Educational Testing Service, the U.S. Department of Labor, the U.S. Congress Joint Economic Committee, the National Commission for Employment Policy, and the Washington State senate. His commentaries have appeared in the New York Times, the Washington Post, the Wall Street Journal, and other print and broadcast media. The author of Rebound: Why America Will Emerge Stronger from the Financial Crisis and Social Stratification in the United States: The American Profile Poster (The New Press), he lives in Washington, DC.

ALSO BY STEPHEN J. ROSE

Rebound:Why America Will Emerge Stronger from the Financial Crisis

Contents Description of the Poster and Booklet MANY TEACHERS AND - photo 2
Contents
Description of the Poster and Booklet

MANY TEACHERS AND COMMENTATORS have used visual images to portray disparities in the distribution of income in the United States. The purpose of this poster and booklet is to show, in an easily accessible way, how various groups in the American population are faring in terms of several social indicators. Much of this information is discussed in the media and in classrooms, but the numbers, percentages, and median figures can be confusing and hard to relate to one another.

The poster is an attempt to overcome this problem by presenting the data in a single visual picture. In this form, the relationship of income, wealth, and education to such variables as race, gender, and household type are visible at a glance.

One of the original purposes of the poster was to show the vast differences in incomes across the American population in 1979. Compared with earlier editions, especially with that first poster, many things have changed. This is the eighth edition, which presents data that reflect 2019 incomes (2020 data were also available but not used because of the economic disruption of the COVID pandemic). Inequality in 2019 is substantially greater than it was forty years ago, making the 1979 distribution look much fairer.

The eighth edition is based on the same categories with the one exception of the 2014 poster, which used educational attainment in place of occupation. Given that all the data come from various years of the Annual Socioeconomic Supplement of the March Current Population Surveys (CPS), it is easy to show how family types, races, educational attainment, occupations, and incomes have changed over time because the Census Bureau has contracted the Minnesota Population Center to harmonize the answers of different census surveys and for different years of each survey. The data for this poster come from the March 2020 Current Population Survey (CPS); the demographics come from March 2020, but the income and earnings are based on 2019 levels.

In addition, other changes include the rising shares of Hispanics and Asians, a huge increase in the share of workers with a four-year degree (see ), and an economy in which manufacturing has a much smaller influence. All these changes are documented, and the poster shows how they affect rising inequality. Furthermore, data from 1999 will show whether these changes were occurring in the twenty years since the first edition of this poster/ book in 1979 or in the next twenty years from 1999 to 2019.

The icons are distributed along two separate income lines. The graph with larger icons, on the left side of the poster, shows the 91 percent of the population with combined gross household income (before taxes are deducted) up to $280,000. The graph on the right side of the poster depicts the population with incomes of up to the four icons that have incomes over $800,000. Also included with this graph are rows of green dollars to show the average level of wealth of households at different levels of income. Wealth consists of assets held rather than wages and salaries. Most peoples wealth consists of tangible thingshouses, cars, consumer durables, and so onwhile the bulk of the richest peoples wealth is composed of financial assets, such as stocks, bonds, insurance policies, and the businesses they own.

Table 1

Number of icons on the poster broken out by family type

Marrried/cohabitorsSingle men Single women Single males with dependents - photo 3

Single menSingle women Single males with dependents Single females with - photo 4

Single womenSingle males with dependents Single females with dependents 1 - photo 5

Single males with dependentsSingle females with dependents 1979 1999 - photo 6

Single females with dependents1979 1999 2019 - photo 7

1979

1999

2019

THE TABLES AND FIGURES in this booklet complement the poster by presenting a complete mathematical breakdown of each of the statistical relationships. These are the building blocks from which the poster has been constructed.

After all the data are represented, attention is paid to the widely used concept of middle class. In the first booklet, I wrote that the term middle class was useless because it was so broad as to have no meaning. This position has been validated in many surveys by the Pew Research Center that show that approximately 90 percent of Americans choose middle class when given the choice of identifying as lower, middle, or upper class. In the second version of the poster, I reported that the middle class had shrunk between 1979 and 1983.

The poster and accompanying data allow the viewer to investigate what various components of the middle class have in common and the ways in which they differ. The purpose is to stimulate discussion about these important questions rather than provide answers. The first chapter discusses statistics, mathematical figures, and government surveys. The next six chapters deal with various relationships: families, education, race, income, and wealth. The following two chapters deal with defining five social groups, with three being lower, middle, and upper middle class. shows the growth of the upper middle class and the growth of the number qualifying as rich. The ninth chapter looks at multiyear experiences of the five income groups. The final chapter explores the causes of income inequality.

At the end of the text are three appendices. The first appendix presents suggestions for classroom use. The second appendix lists references and government data sources. Finally, the third appendix lists cited and uncited papers by this author.

Next page
Light

Font size:

Reset

Interval:

Bookmark:

Make

Similar books «Social Stratification in the United States: The American Profile Poster of Who Owns What, Who Makes How Much, and Who Works Where»

Look at similar books to Social Stratification in the United States: The American Profile Poster of Who Owns What, Who Makes How Much, and Who Works Where. We have selected literature similar in name and meaning in the hope of providing readers with more options to find new, interesting, not yet read works.


Reviews about «Social Stratification in the United States: The American Profile Poster of Who Owns What, Who Makes How Much, and Who Works Where»

Discussion, reviews of the book Social Stratification in the United States: The American Profile Poster of Who Owns What, Who Makes How Much, and Who Works Where and just readers' own opinions. Leave your comments, write what you think about the work, its meaning or the main characters. Specify what exactly you liked and what you didn't like, and why you think so.