Time series databases enable a fundamental step in the central storage and analysis of many types of machine data. As such, they lie at the heart of the Internet of Things (IoT). Theres a revolution in sensortoinsight data flow that is rapidly changing the way we perceive and understand the world around us. Much of the data generated by sensors, as well as a variety of other sources, benefits from being collected as time series.
Although the idea of collecting and analyzing time series data is not new, the astounding scale of modern datasets, the velocity of data accumulation in many cases, and the variety of new data sources together contribute to making the current task of building scalable time series databases a huge challenge. A new world of time series data calls for new approaches and new tools.
In This Book
The huge volume of data to be handled by modern time series databases (TSDB) calls for scalability. Systems like Apache Cassandra, Apache HBase, MapR-DB, and other NoSQL databases are built for this scale, and they allow developers to scale relatively simple applications to extraordinary levels. In this book, we show you how to build scalable, high-performance time series databases using open source software on top of Apache HBase or MapR-DB. We focus on how to collect, store, and access large-scale time series data rather than the methods for analysis.
provide you with an explanation of the concepts involved in building a high-performance TSDB and a detailed examination of how to implement them. The remaining chapters explore some more advanced issues, including how time series databases contribute to practical machine learning and how to handle the added complexity of geo-temporal data.
The combination of conceptual explanation and technical implementation makes this book useful for a variety of audiences, from practitioners to business and project managers. To understand the implementation details, basic computer programming skills suffice; no special math or language experience is required.
We hope you enjoy this book.
Chapter 1. Time Series Data: Why Collect It?
Collect your data as if your life depends on it!
This bold admonition may seem like a quote from an overzealous project manager who holds extreme views on work ethic, but in fact, sometimes your life does depend on how you collect your data. Time series data provides many such serious examples. But lets begin with something less life threatening, such as: where would you like to spend your vacation?
Suppose youve been living in Seattle, Washington for two years. Youve enjoyed a lovely summer, but as the season moves into October, you are not looking forward to what you expect will once again be a gray, chilly, and wet winter. As a break, you decide to treat yourself to a short holiday in December to go someplace warm and sunny. Now begins the search for a good destination.
You want sunshine on your holiday, so you start by seeking out reports for rainfall in potential vacation places. Reasoning that an average of many measurements will provide a more accurate report than just checking what is happening at the moment, you compare the yearly rainfall average for the Caribbean country of Costa Rica (about 77 inches or 196 cm) with that of the South American coastal city of Rio de Janeiro, Brazil (46 inches or 117cm). Seeing that Costa Rica gets almost twice as much rain per year on average than Rio de Janeiro, you choose the Brazilian city for your December trip and end up slightly disappointed when it rains all four days of your holiday.
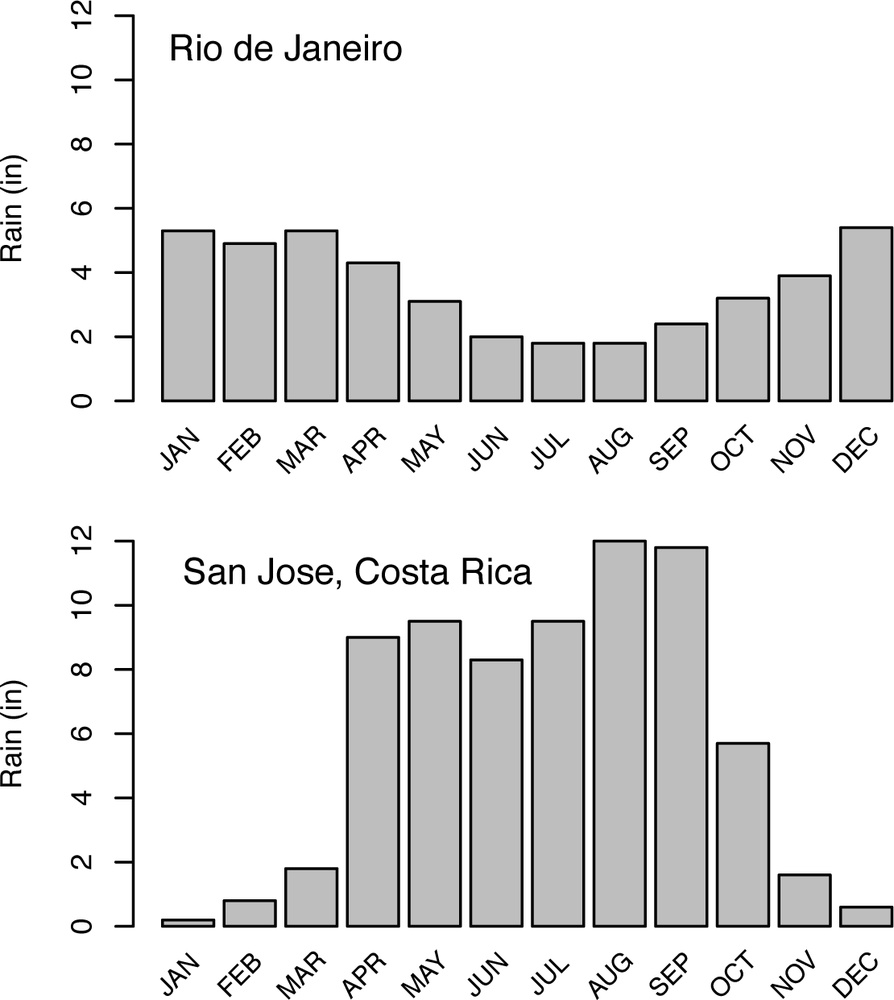
The probability of choosing a sunny destination for December might have been better if you had looked at rainfall measurements recorded with the time at which they were made throughout the year rather than just an annual average. A pattern of rainfall would be revealed, as shown in . With this time series style of data collection, you could have easily seen that in December you were far more likely to have a sunny holiday in Costa Rica than in Rio, though that would certainly not have been true for a September trip.
Figure 1-1. These graphs show the monthly rainfall measurements for Rio de Janeiro, Brazil, and San Jose, Costa Rica. Notice the sharp reduction in rainfall in Costa Rica going from SeptemberOctober to DecemberJanuary. Despite a higher average yearly rainfall in Costa Rica, its winter months of December and January are generally drier than those months in Rio de Janeiro (or for that matter, in Seattle).
This small-scale, lighthearted analogy hints at the useful insights possible when certain types of data are recorded as a time seriesas measurements or observations of events as a function of the time at which they occurred. The variety of situations in which time series are useful is wide ranging and growing, especially as new technologies are producing more data of this type and as new tools are making it feasible to make use of time series data at large scale and in novel applications. As we alluded to at the start, recording the exact time at which a critical parameter was measured or a particular event occurred can have a big impact on some very serious situations such as safety and risk reduction. The airline industry is one such example.
Recording the time at which a measurement was made can greatly expand the value of the data being collected. We have all heard of the flight data recorders used in airplane travel as a way to reconstruct events after a malfunction or crash. Oddly enough, the public sometimes calls them black boxes, although they are generally painted a bright color such as orange. A modern aircraft is equipped with sensors to measure and report data many times per second for dozens of parameters throughout the flight. These measurements include altitude, flight path, engine temperature and power, indicated air speed, fuel consumption, and control settings. Each measurement includes the time it was made. In the event of a crash or serious accident, the events and actions leading up to the crash can be reconstructed in exquisite detail from these data.
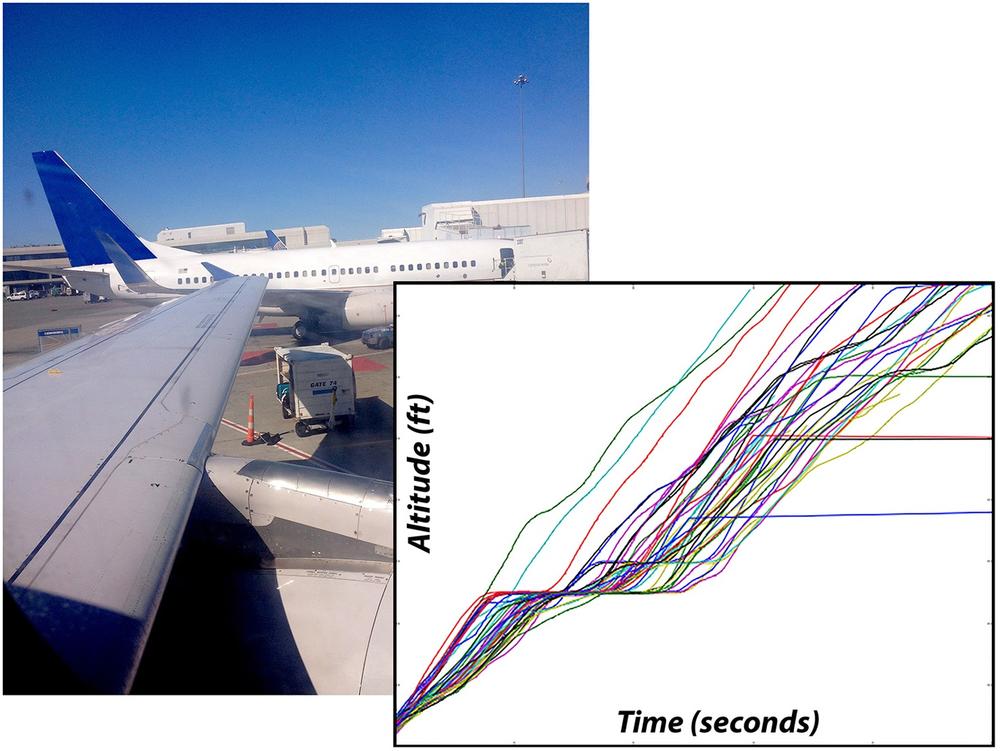
Flight sensor data is not only used to reconstruct events that precede a malfunction. Some of this sensor data is transferred to other systems for analysis of specific aspects of flight performance in order for the airline company to optimize operations and maintain safety standards and for the equipment manufacturers to track the behavior of specific components along with their microenvironment, such as vibration, temperature, or pressure. Analysis of these time series datasets can provide valuable insights that include how to improve fuel consumption, change recommended procedures to reduce risk, and how best to schedule maintenance and equipment replacement. Because the time of each measurement is recorded accurately, its possible to correlate many different conditions and events. displays time series data, the altitude data from flight data systems of a number of aircraft taking off from San Jose, California.

