Oliver Theobald - Statistics for Absolute Beginners (Second Edition)
Here you can read online Oliver Theobald - Statistics for Absolute Beginners (Second Edition) full text of the book (entire story) in english for free. Download pdf and epub, get meaning, cover and reviews about this ebook. year: 2020, publisher: Scatterplot Press, genre: Romance novel. Description of the work, (preface) as well as reviews are available. Best literature library LitArk.com created for fans of good reading and offers a wide selection of genres:
Romance novel
Science fiction
Adventure
Detective
Science
History
Home and family
Prose
Art
Politics
Computer
Non-fiction
Religion
Business
Children
Humor
Choose a favorite category and find really read worthwhile books. Enjoy immersion in the world of imagination, feel the emotions of the characters or learn something new for yourself, make an fascinating discovery.

- Book:Statistics for Absolute Beginners (Second Edition)
- Author:
- Publisher:Scatterplot Press
- Genre:
- Year:2020
- Rating:5 / 5
- Favourites:Add to favourites
- Your mark:
Statistics for Absolute Beginners (Second Edition): summary, description and annotation
We offer to read an annotation, description, summary or preface (depends on what the author of the book "Statistics for Absolute Beginners (Second Edition)" wrote himself). If you haven't found the necessary information about the book — write in the comments, we will try to find it.
Written by the author of Amazon Best Seller Machine Learning for Absolute Beginners, this book guides you through the fundamentals of inferential and descriptive statistics with a mix of practical demonstrations, visual examples, historical origins, and plain English explanations. As a resource for beginners, this book wont teach you how to beat the market or predict the next U.S. election but ensures a concise and simple-to-understand supplement to a standard textbook.
This includes an introduction to important techniques used to infer predictions from data, such as hypothesis testing, linear regression analysis, confidence intervals, probability theory, and data distribution. Descriptive statistics techniques such as central tendency measures and standard deviation are also covered in this book.
Full Overview of Book Themes
Historical Development of Statistics
Data Sampling
Central Tendency Measures
Measures Of Spread
Measures Of Position
Designing Hypothesis Tests
Probability & Bayes Theory
Regression Analysis
Clustering Analysis
As the launch pad to quantitative research, business optimization or a promising career in data science, its never been a better time to brush up on statistics or learn these concepts for the very first time.
Oliver Theobald: author's other books
Who wrote Statistics for Absolute Beginners (Second Edition)? Find out the surname, the name of the author of the book and a list of all author's works by series.


Statistics for Absolute Beginners (Second Edition) — read online for free the complete book (whole text) full work
Below is the text of the book, divided by pages. System saving the place of the last page read, allows you to conveniently read the book "Statistics for Absolute Beginners (Second Edition)" online for free, without having to search again every time where you left off. Put a bookmark, and you can go to the page where you finished reading at any time.
Font size:
Interval:
Bookmark:
Statistics for Absolute Beginners
A Plain English Introduction
Oliver Theobald
Published by Scatterplot Press
Second Edition
Copyright 2017 by Oliver Theobald
All rights reserved. No part of this publication may be reproduced, distributed, or transmitted in any form or by any means, including photocopying, recording, or other electronic or mechanical methods, without the prior written permission of the publisher, except in the case of brief quotations embodied in critical reviews and certain other non-commercial uses permitted by copyright law.
Please contact the author at oliver.theobald@scatterplotpress.com for feedback, media contact, a university desk copy, omissions or errors regarding this book.
Find Us On:
Skillshare
www.skillshare.com/user/machinelearning_beginners
Teachable
http://scatterplotpress.teachable.com/
YouTube
Scatterplot Media
machinelearning_beginners
TABLE OF CONTENTS
General Terms
Data
A term for any value that describes the characteristics and attributes of an item that can be moved, processed, and analyzed. The item could be a transaction, a person, an event, a result, a change in the weather, and infinite other possibilities. Data can contain various sorts of information, and through statistical analysis, these recorded values can be better understood and used to support or debunk a research hypothesis.
Population
The parent group from which the experiments data is collected, e.g., all registered users of an online shopping platform or all investors of cryptocurrency.
Sample
A subset of a population collected for the purpose of an experiment, e.g., 10% of all registered users of an online shopping platform or 5% of all investors of cryptocurrency. A sample is often used in statistical experiments for practical reasons, as it might be impossible or prohibitively expensive to directly analyze the full population.
Variable
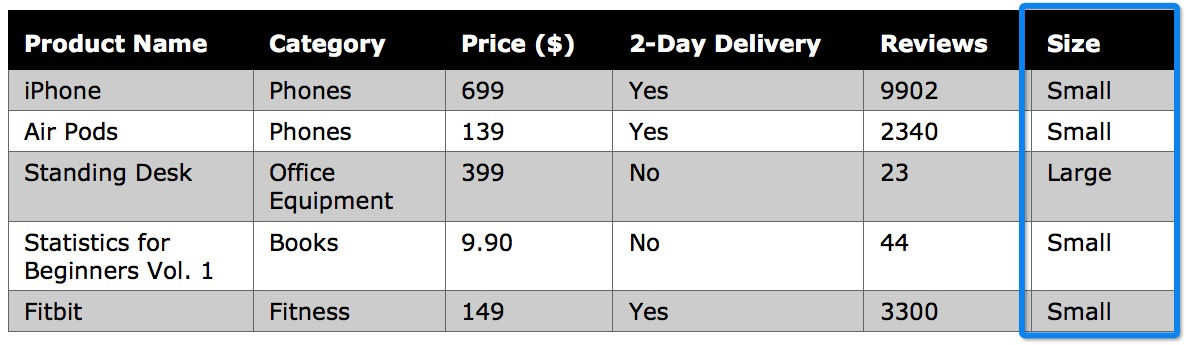
A characteristic of an item from the population that varies in quantity or quality from another item, e.g., the Category of a product sold on Amazon. A variable that varies in regards to quantity and takes on numeric values is known as a quantitative variable , e.g., the Price of a product. A variable that varies in quality/class is called a qualitative variable, e.g., the Product Name of an item sold on Amazon. This process is often referred to as classification , as it involves assigning a class to a variable.
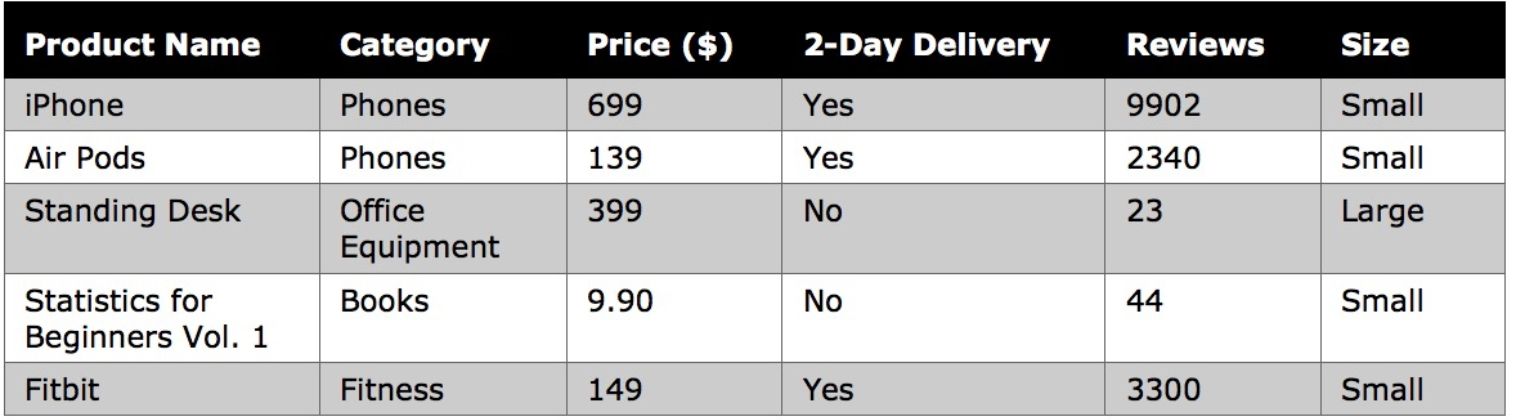
Amazon product dataset
Discrete Variable
A variable that can only accept a finite number of values, e.g., customers purchasing a product on Amazon.com can rate the product as 1, 2, 3, 4, or 5 stars. In other words, the product has five distinct rating possibilities, and the reviewer cannot submit their own rating value of 2.5 or 0.0009. Helpful tip: qualitative variables are discrete, e.g., Name or Category of a product.
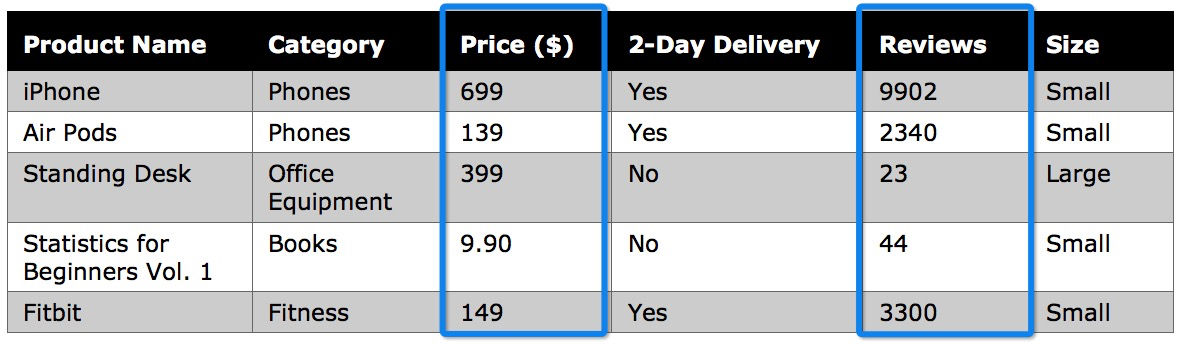
Continuous Variable
A variable that can assume an infinite number of values, e.g., depending on supply and demand, gold can be converted into unlimited possible values expressed in U.S. dollars. Opposite to a discrete variable, a continuous variable can also assume values arbitrarily close together. In the case of our dataset, Price and Reviews are continuous variables.
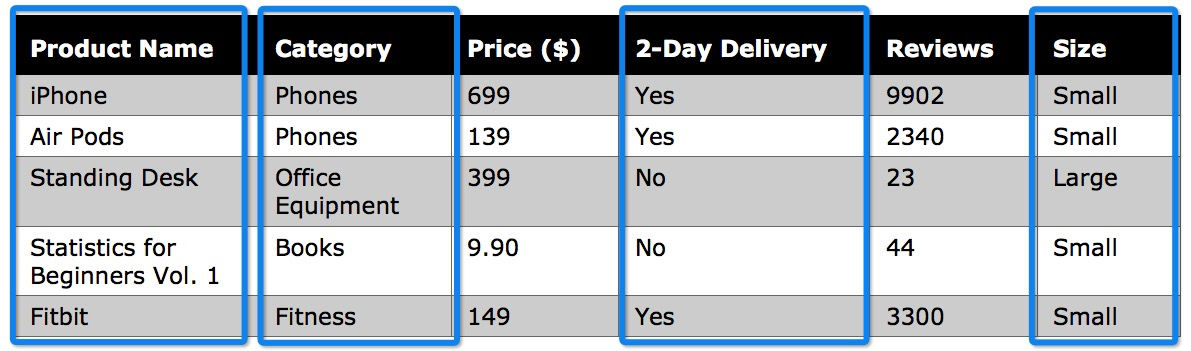
Categorical Variables
A variable whose possible values consist of a discrete set of categories, such as gender or political allegiance, rather than numbers quantifying values on a continuous scale.
Ordinal Variables
As a subcategory of categorical variables, ordinal variables categorize values in a logical and meaningful sequence. Unlike standard categorical variables, i.e. gender or film genre, ordinal variables contain an intrinsic ordering or sequence such as { small ; medium ; large } or { dissatisfied ; neutral ; satisfied ; very satisfied }.
The distance of separation between ordinal variables does not need to be consistent or quantified. For example, the measurable gap in performance between a gold and silver medalist in athletics need not mirror the difference in performance between a silver and bronze medalist.
Independent and Dependent Variables
An independent variable (expressed as X) is the variable that supposedly impacts the dependent variable (expressed as y). For example, the supply of oil (independent variable) impacts the cost of fuel (dependent variable). As the dependent variable is dependent on the independent variable, it is generally the independent variable that is tested in experiments. As the value of the independent variable changes, the effect on the dependent variable is observed and recorded.
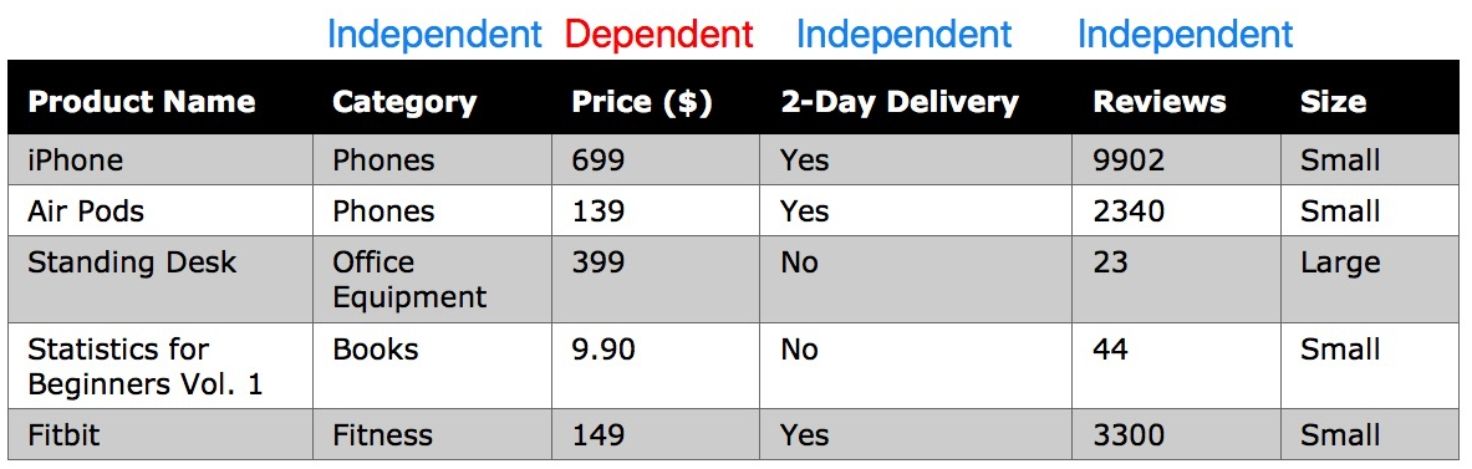
In analyzing Amazon products, we could examine Category , Reviews , and 2-Day Delivery as the independent variables and observe how changes in those variables affect the dependent variable of Price . Equally, we could select the Reviews variable as the dependent variable and examine Price, 2-Day Delivery , and Category as the independent variables and observe how these variables influence the number of customer reviews.
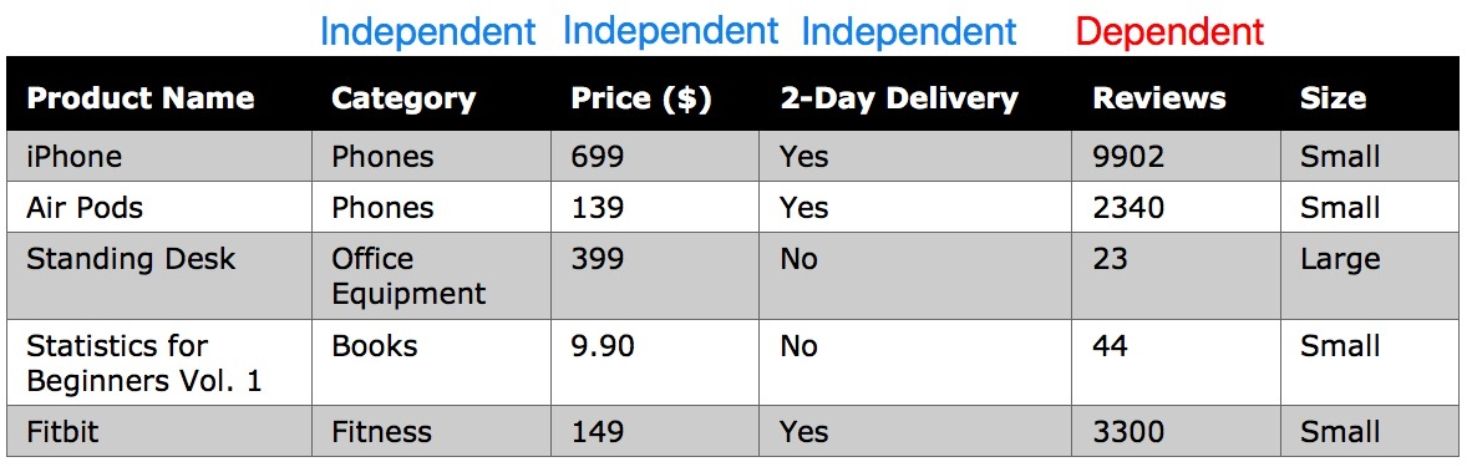
The labels of independent and dependent are hence determined by experiment design rather than inherent composition, which means one variable could be a dependent variable in one study and an independent variable in another.
Lets listen to the data.
Do you have the numbers to back that up?
We live in an age and society where we trust technology and quantifiable information more than we trust each otherand sometimes ourselves. The gut feeling and conviction of Steve Jobs to know what consumers would later want is revered and romanticized. Yet theres sparse literature ( Blink by Malcolm Gladwell is a notable exception), an eerie absence of online learning courses, and little sign of a mainstream movement promoting one persons unaided intuition as a prerequisite to success in business. Everyone is too preoccupied with thinking about quantitative evidence, including the personal data generated by Apples expanding line of products. Extensive customer profiling and procuring data designed to wrench out our every hidden desire are dominant and pervasive trends in business today.
Perhaps Jobs represents a statistical anomaly. His legacy cannot be wiped from the dataset, but few in the business world would set out to emulate him without data in their pocket. As Wired Magazines Editor-in-chief Chris Anderson puts it, we dont need theories but rather data to look at and analyze in the current age of big data.
Databoth big and smallis collected instantly and constantly: how far we travel each day, who we interact with online and where we spend our money. Every bit of data has a story to tell. But, left isolated, these parcels of information rest dormant and underutilizedequivalent to Lego blocks cordoned into bags of separate pieces .
Next pageFont size:
Interval:
Bookmark:
Similar books «Statistics for Absolute Beginners (Second Edition)»
Look at similar books to Statistics for Absolute Beginners (Second Edition). We have selected literature similar in name and meaning in the hope of providing readers with more options to find new, interesting, not yet read works.
Discussion, reviews of the book Statistics for Absolute Beginners (Second Edition) and just readers' own opinions. Leave your comments, write what you think about the work, its meaning or the main characters. Specify what exactly you liked and what you didn't like, and why you think so.