Wayne Walker - Advanced Technical Analysis For Forex
Here you can read online Wayne Walker - Advanced Technical Analysis For Forex full text of the book (entire story) in english for free. Download pdf and epub, get meaning, cover and reviews about this ebook. year: 2017, publisher: PublishDrive, genre: Business. Description of the work, (preface) as well as reviews are available. Best literature library LitArk.com created for fans of good reading and offers a wide selection of genres:
Romance novel
Science fiction
Adventure
Detective
Science
History
Home and family
Prose
Art
Politics
Computer
Non-fiction
Religion
Business
Children
Humor
Choose a favorite category and find really read worthwhile books. Enjoy immersion in the world of imagination, feel the emotions of the characters or learn something new for yourself, make an fascinating discovery.

- Book:Advanced Technical Analysis For Forex
- Author:
- Publisher:PublishDrive
- Genre:
- Year:2017
- Rating:3 / 5
- Favourites:Add to favourites
- Your mark:
Advanced Technical Analysis For Forex: summary, description and annotation
We offer to read an annotation, description, summary or preface (depends on what the author of the book "Advanced Technical Analysis For Forex" wrote himself). If you haven't found the necessary information about the book — write in the comments, we will try to find it.
In Advanced Technical Analysis for Forex, we continue our journey to acquire a broader and deeper understanding of technical analysis for forex. The emphasis is on practical applications. You will learn advanced technical analysis indicators that can increase your money making ability. The results from past students and readers confirms their effectiveness.
The book includes:
- Step-by-step guide to understanding and advanced technical analysis indicators
- Strategic trading tactics to use with your expanded knowledge of technical analysis
- Trader psychology
- Price Patterns
- Using Multiple Time Frames
Wayne Walker: author's other books
Who wrote Advanced Technical Analysis For Forex? Find out the surname, the name of the author of the book and a list of all author's works by series.


Advanced Technical Analysis For Forex — read online for free the complete book (whole text) full work
Below is the text of the book, divided by pages. System saving the place of the last page read, allows you to conveniently read the book "Advanced Technical Analysis For Forex" online for free, without having to search again every time where you left off. Put a bookmark, and you can go to the page where you finished reading at any time.
Font size:
Interval:
Bookmark:
Advanced Technical Analysis For Forex
Take Your Technical Analysis To The Next Level For Greater Profits
WAYNE WALKER
Copyright 2017 by Wayne Walker, All rights reserved.
This book was written with the goal of providing information that is as accurate and reliable as possible. Professionals should be consulted as needed before undertaking any of the actions endorsed herein.
This declaration is deemed fair and valid by both the American Bar Association and the Committee of Publishers Association and is legally binding throughout the United States.
Furthermore, the transmission, duplication or reproduction of any of the following work, including precise information, will be considered an illegal act, irrespective whether it is done electronically or in print. The legality extends to creating a secondary or tertiary copy of the work or a recorded copy and is only allowed with express written consent of the Publisher. All additional rights are reserved.
The information in the following pages is broadly considered to be a truthful and accurate account of facts, and as such any inattention, use or misuse of the information in question by the reader will render any resulting actions solely under their purview. There are no scenarios in which the publisher or the author of this work can be in any fashion deemed liable for any hardship or damages that may befall them after undertaking information described herein.
 |  |


C ONGRATULATIONS ON your personal copy of Advanced Technical Analysis for Forex. We continue our journey from the first book to acquire a broader and deeper understanding of technical analysis for forex. The emphasis remains on practical applications. You will be introduced to new strategies along with the know-how on how to apply them. We will also examine more advanced technical analysis indicators that can increase your money making ability.
The final chapters cover advanced fundamental analysis and the often overlooked area of trader psychology. These sections are a bonus to traders of all types. Thanks for choosing this book!
| |
C HARTING ESSENTIALS
Charts are a forex trader's best tool. As a trader, you will most likely use your charts more than any other available tool. Since your charts will play such a large role in your trading, it is important that you become familiar with them. The more comfortable you are with your charts, the easier it will be to become a profitable forex trader.
To help you become acquainted with charts and how you can effectively use them, we will cover the following concepts: chart setup, chart timeframes, chart types. We will also cover the useful technical indicators you can add to your charts to improve your trading results in the later chapters. We will begin with some base concepts to quickly prep you for more advanced content later.
Chart Setup
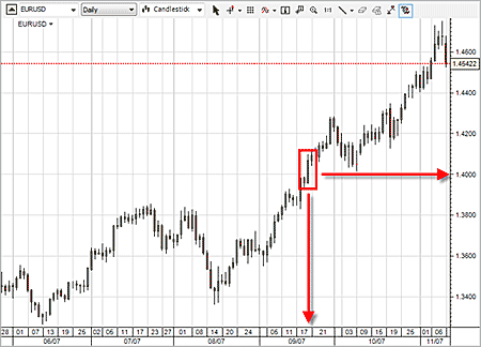
Let us start from the base and take a look at how a forex price chart is put together. Once you understand the basics, you will find it easier to apply the more advanced concepts to your technical analysis. Forex price charts are built on two axes: the X axis (horizontal axis) and the Y axis (vertical axis).
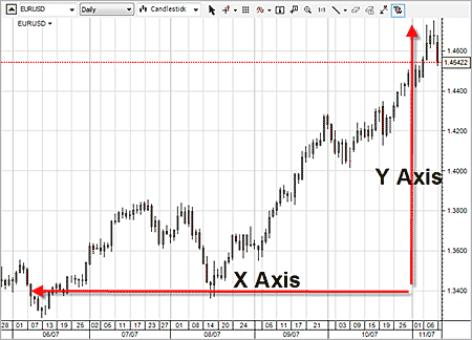
T HE X AXIS RUNS HORIZONTALLY along the bottom of the chart providing a timeline for everything that has happened on the chart. The most recent price action is shown on the right side of the chart.
The Y axis runs vertically along the right side of the chart providing a price scale for the price movement on the chart. Lower prices are shown toward the bottom of the chart and the higher prices are shown toward the top of the chart.
When you combine the two axes together, you can see at what price a currency pair was trading at a particular time in the past.
C HART TYPES
Forex charts give you the ability to analyze the price movement of a currency pair in various formats, from bar charts to candlestick charts. You have the option to select which format is best for you.
Technical analysis is a skill that traders develop, and different traders like to practice their art on different types of charts. Some traders believe they can see and analyze support and resistance levels better on a line chart while other traders feel they get more information on price movements on a bar or a candlestick chart. Technical analysts tend to work with the following three chart types:
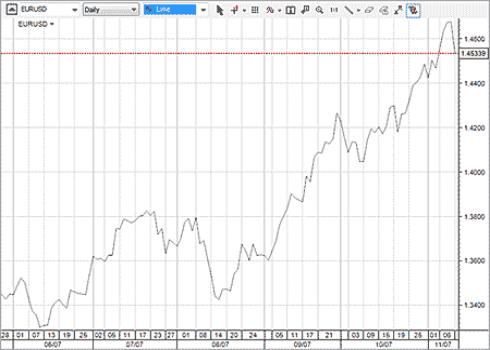
Line Charts
Line charts are the most basic type of chart. Technical analysts often use line charts to quickly identify support and resistance levels. Line charts only have basic information plotted on them, which means there is not a lot of other information to cloud your analysis. You create a line chart by plotting the closing price of each trading period on a chart and then connecting each closing price with a line. You can see an example of a line chart below.
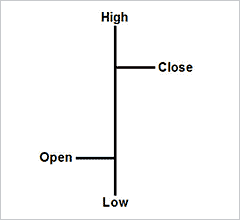
B AR CHARTS
Bar charts provide more information than a line chart. Technical traders often use bar charts to gain more information about how a currency pair's price fluctuated during each trading period. Whereas line charts only plot the closing price from each trading period, bar charts plot the opening, high, low and closing prices from each period.
You create a bar chart by plotting a series of bars across the chart. Each bar represents one trading period. To create a bar, you plot the high and low price of a trading period and connect them with a vertical line. Next, you plot the opening price out to the left side of the vertical line you have just drawn and connect that point to the vertical line with a horizontal line. Last, you plot the closing price out to the right side of the vertical line you have just drawn and connect that point to the vertical line with a horizontal line.
S EEING WHERE A CURRENCY pair started the trading period compared to where it ended the trading period can help you to better identify trends. If the price closes higher than it opened, you know investors were bullish on the currency pair during the trading period. If the price closes lower than it opened, you know investors were bearish on the currency pair during the trading period. You can see an example of a bar chart below.
Next pageFont size:
Interval:
Bookmark:
Similar books «Advanced Technical Analysis For Forex»
Look at similar books to Advanced Technical Analysis For Forex. We have selected literature similar in name and meaning in the hope of providing readers with more options to find new, interesting, not yet read works.
Discussion, reviews of the book Advanced Technical Analysis For Forex and just readers' own opinions. Leave your comments, write what you think about the work, its meaning or the main characters. Specify what exactly you liked and what you didn't like, and why you think so.