• Complain

Heikin Ashi Trader - Forex Trading 1-2: 2 Manuscripts: Book 1: Practical Examples Book 2: How Do I Rate My Trading Results?

Here you can read online Heikin Ashi Trader - Forex Trading 1-2: 2 Manuscripts: Book 1: Practical Examples Book 2: How Do I Rate My Trading Results? full text of the book (entire story) in english for free. Download pdf and epub, get meaning, cover and reviews about this ebook. year: 2018, publisher: Dao Press LLC, genre: Science fiction. Description of the work, (preface) as well as reviews are available. Best literature library LitArk.com created for fans of good reading and offers a wide selection of genres:

Romance novel Science fiction Adventure Detective Science History Home and family Prose Art Politics Computer Non-fiction Religion Business Children Humor

Choose a favorite category and find really read worthwhile books. Enjoy immersion in the world of imagination, feel the emotions of the characters or learn something new for yourself, make an fascinating discovery.

Heikin Ashi Trader Forex Trading 1-2: 2 Manuscripts: Book 1: Practical Examples Book 2: How Do I Rate My Trading Results?
  • Book:
    Forex Trading 1-2: 2 Manuscripts: Book 1: Practical Examples Book 2: How Do I Rate My Trading Results?
  • Author:
  • Publisher:
    Dao Press LLC
  • Genre:
  • Year:
    2018
  • Rating:
    5 / 5
  • Favourites:
    Add to favourites
  • Your mark:
    • 100
    • 1
    • 2
    • 3
    • 4
    • 5

Forex Trading 1-2: 2 Manuscripts: Book 1: Practical Examples Book 2: How Do I Rate My Trading Results?: summary, description and annotation

We offer to read an annotation, description, summary or preface (depends on what the author of the book "Forex Trading 1-2: 2 Manuscripts: Book 1: Practical Examples Book 2: How Do I Rate My Trading Results?" wrote himself). If you haven't found the necessary information about the book — write in the comments, we will try to find it.

This Forex Trading book includes 2 books.

Book 1: Practical examples

Scalping is the fastest way to make money in the stock market. There is hardly another method that can be found that increases a traders capital more effectively. The Heikin Ashi Trader explains why this is so in this four-part series on scalping.

In this first book, he explains his setup with many practical examples. You will learn how to interpret Heikin-Ashi charts correctly, when to get into a market and when to get out. Also, you will learn how to combine the setup with important principles of technical analysis.

This highly effective scalping strategy can be applied in a short time frame; for instance, a 1-minute chart in addition to other higher time frames. You can trade using this universal method in equity indices and in the currency markets. Typical instruments, however, are futures and currencies.

Book 2: How do I rate my Trading Results?

In this second book, the Heikin Ashi trader answers the question of how the trading results of a scalper are analyzed and correctly evaluated. Based on the weekly results of a single trader, he examines what factors matter to having long-term success in the stock market. The analysis of the trading journal for 12 weeks allows an inside look at the learning curve of a budding professional.Table of Contents

Book 1: Forex Trading, Practical Examples

1. Scalping with Technical Analysis

2. How do I Interpret Heikin Ashi Charts?

3. When Do I Get In?

4. When Do I Get Out?

5. Working with Price Objectives

6. Heikin Ashi Scalping in Practice

7. Does Technical Analysis Help While Heikin Ashi Scalping?

A. Support and Resistance

B. Swing High and Swing Low of the Previous Day

C. The Importance of the Round Number in Forex

8. How Do I Recognize Trend Days?

9. How Do I Scalp Trend Days?

10. Conclusion

Book 2: How Do I Rate my Trading Results?

1. The Trading Journal as a weapon

2. The first 12 weeks of a new Scalper

- Week 1

- Week 2

- Week 3

- Week 4

- Week 5

- Week 6

- Week 7

- Week 8

- Week 9

- Week 10

- Week 11

- Week 12

3. How is Jenny doing now?

4. Scalping is a Business

More Books by Heikin Ashi Trader

About the Author

Imprint

Heikin Ashi Trader: author's other books


Who wrote Forex Trading 1-2: 2 Manuscripts: Book 1: Practical Examples Book 2: How Do I Rate My Trading Results?? Find out the surname, the name of the author of the book and a list of all author's works by series.


Forex Trading 1-2: 2 Manuscripts: Book 1: Practical Examples Book 2: How Do I Rate My Trading Results? — read online for free the complete book (whole text) full work

Below is the text of the book, divided by pages. System saving the place of the last page read, allows you to conveniently read the book "Forex Trading 1-2: 2 Manuscripts: Book 1: Practical Examples Book 2: How Do I Rate My Trading Results?" online for free, without having to search again every time where you left off. Put a bookmark, and you can go to the page where you finished reading at any time.

Light

Font size:

Reset

Interval:

Bookmark:

Make

Forex Trading

2 Manuscripts:

Book 1: Practical Examples

Book 2: How Do I Rate my Trading Results?

Heikin Ashi Trader

SPLENDID ISLAND

Table of Contents

Book 1: Practical Examples

Book 2: How Do I Rate my Trading Results?

Book 1: Practical Examples

1. Scalping With Technical Analysis

In the first book of this series, "Scalping is Fun", I had presented a simple scalping setup that can be applied at any time, regardless of whether the market is in a trend or is passing sideways. This setup is universal and can be applied for any time frame. The second book in the series digs deeper into this basic set-up by presenting a number of typical patterns that come from technical analysis. These patterns are usually easy to understand and effective to use. Even if you are only slightly familiar with technical analysis, you can still apply the examples that are highlighted in this second book.

This book is a result of many questions that I have received from participants in my webinars and my mentoring program. With this second book, I hope answer these questions. I have been scalping for more than 14 years, but I will never stop learning or stop striving for improvement. That's why, at this point, I would like to thank all these traders for their questions and comments, because they ultimately have given the impetus for this second book.

This book doesnt cover the advanced stage of my setup; regardless, I am convinced that you can trade using this simple method without any knowledge of classical technical analysis. Most traders that I know, including myself, began their trading career by studying charts, and this has advantages as well as disadvantages. Technical Analysis can be compared to cartography; the trader learns to interpret past movements and the current situation in the context of the past. You learn, so to speak, to read a map. Where the journey will take you in the future, you still do not know.

The disadvantage of this method is that, over time, you lose your initial fresh perspective when looking at the charts. At a glance, experienced chartists see striking highs and lows. They spot support and resistance levels and they identify trends, continuation pattern, reversal patterns, etc. With their trained eyes, they have to do this. Just try to look at any chart without seeing these patterns. If you work already two or three years with technical analysis, you will probably not succeed.

But this unbiased view belongs to people have who have never read a book on technical analysis. If they were in front of a painting that you would describe as "abstract, the technical analyst would see streets, houses, trees in short, a whole landscape. We probably may never have this completely unbiased view anymore, having grown up with charting analysis. Computer simulations have also proved this. Simulations are programs that produce pure virtual charts that have no reference to any market or equity. Using charts that are invented purely by computer programs, the chartist will start to identify his familiar pattern. He will begin to draw trend lines, make out significant highs or lows, etc. As you can see, there is no escape from this biased view!

Nevertheless, I believe that as a "Cartographer", you can trade for profit by using the setup put forth by my first book. Here again, the Heikin Ashi Charts help us a lot by visualizing the "flow" of the market like no other. Now, in this second e-book, I want to combine my setup with important elements of technical analysis. However, there is no necessity to use the examples explained. A lot of scalpers who trade this way with one or two trading indicators are fully satisfied. Others actually trade using the pure setup from Book 1 and are successful. With trading, its all about finding or developing the method that suits you best there is no right or wrong.

2. How Do I Interpret Heiken Ashi Charts?

Before we begin with the concrete examples, we should look at the main features of the Heikin Ashi charts, as they will be of use in many examples. First, have a look at this table. It summarizes the most important information about Heikin Ashi charts.

Figure 1: Characteristics of Heikin Ashi Charts

The properties remain the same for both rising and falling markets The Heikin - photo 1

The properties remain the same for both rising and falling markets. The Heikin Ashi charts visualize trends much better than, for example, candlestick charts. They are designed this way in order to identify trends at a glance. The trader knows immediately whether the market is in a rising or falling trend. The colors of the candles leave no doubt.

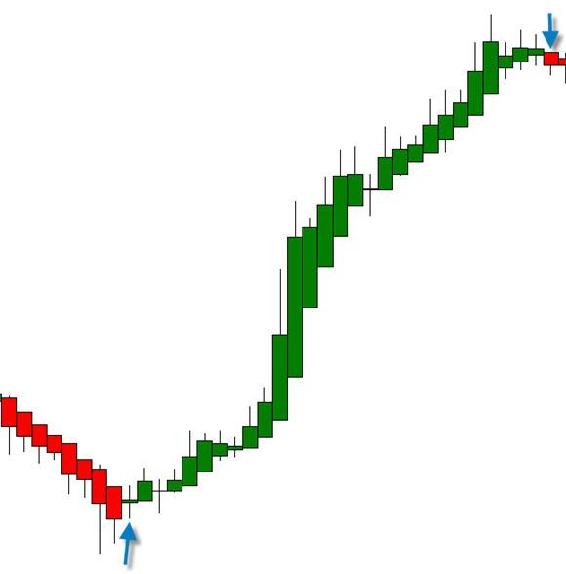
Figure 2: A Trend in the Heikin Ashi Representation

Look at Figure 2 closely All the candles before the bottom arrow are red This - photo 2

Look at Figure 2 closely. All the candles before the bottom arrow are red. This means that the market is in a downward trend. The candle above the blue arrow indicates a doji (which I will soon explain) and is colored green. That would be a classic buy signal for me. We also see how all subsequent candles are green; now, the uptrend begins. At the beginning, the trend is quite hesitant, evident by how the candles are small or insignificant but still green. In the middle of the movement, the candles become significantly larger or longer. The bulls have clearly prevailed. The upward trend is in full development. In the third part of the trend, although still increasing, the candles become smaller again. At the end of the trend, they are just as small as at the beginning and again, a doji appears. The next candle is red, as indicated by the top blue arrow. Finally, the uptrend is over. The color change suggests that a new cycle has begun and that the price is again falling.

As a countertrend scalper, you are a specialist for trends that come to an end. Your analytic job is to identify trends and find out if whether their momentum is strong or weak. Here, the size of the candles is of paramount importance. Large candles, possibly with long shadows, often indicate that the trend is in full development. In rising markets, this means that the bulls unquestioningly have the final say. It speaks without saying that any short trade is prohibited here as well as any long trade! Long, strong candles indicate that the party is in full swing. Everyone is hot and as the last guest, you would definitely be too late.

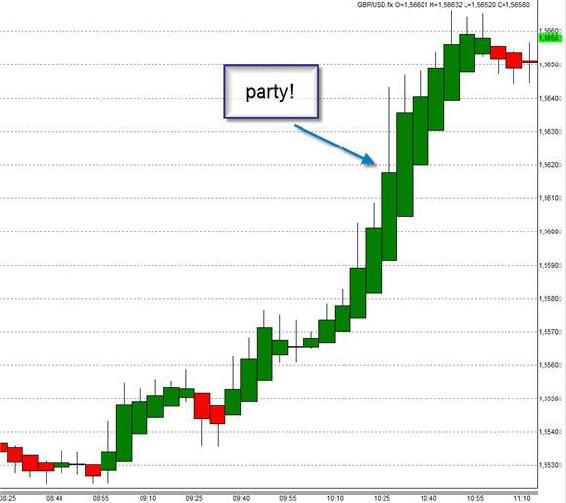
Figure 3: GBP/USD 2-Minute Chart

This figure that shows the GBPUSD makes the party analogy clear The middle - photo 3

This figure that shows the GBP/USD makes the party analogy clear. The middle candle, as indicated by the blue arrow, is the highlight of the party. The bulls buy the pound in this period more than 50 pips higher! At the same time, you will see a long wick, which points out that the party could soon be over. The next candle is a bit smaller and the new high is not much higher than the previous one. Then, the candles begin to get smaller and the last two green candles make no more highs. Here, the bulls have shot their wad and are running out of power. Now, you should follow closely what happens next: on the high of the movement, consolidation candles arise, usually taking the form of a doji or a spinning top.

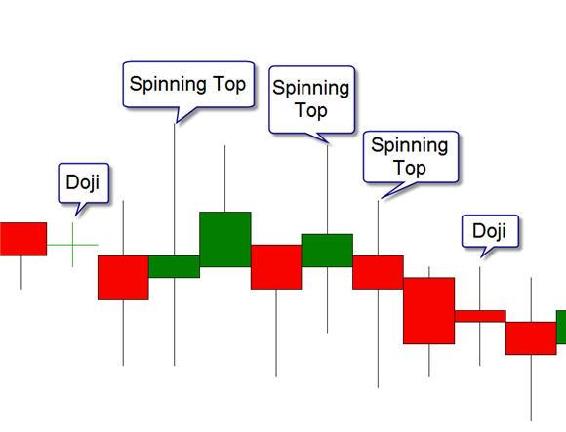
Figure 4: Doji And Spinning Tops

The difference between the two is easy to recognize Dojis have small wicks and - photo 4

The difference between the two is easy to recognize. Dojis have small wicks and almost no real body whereas spinning tops often have long wicks and a small real body. A doji is similar to a cross or a plus sign, meaning that the opening price and closing prices of the period is almost identical. A doji signals a balance between buyers and sellers and often heralds a trend change.

Next page
Light

Font size:

Reset

Interval:

Bookmark:

Make

Similar books «Forex Trading 1-2: 2 Manuscripts: Book 1: Practical Examples Book 2: How Do I Rate My Trading Results?»

Look at similar books to Forex Trading 1-2: 2 Manuscripts: Book 1: Practical Examples Book 2: How Do I Rate My Trading Results?. We have selected literature similar in name and meaning in the hope of providing readers with more options to find new, interesting, not yet read works.


Reviews about «Forex Trading 1-2: 2 Manuscripts: Book 1: Practical Examples Book 2: How Do I Rate My Trading Results?»

Discussion, reviews of the book Forex Trading 1-2: 2 Manuscripts: Book 1: Practical Examples Book 2: How Do I Rate My Trading Results? and just readers' own opinions. Leave your comments, write what you think about the work, its meaning or the main characters. Specify what exactly you liked and what you didn't like, and why you think so.