Heikin Ashi Trader - Swing Trading using the 4-hour chart 1-3: 3 Manuscripts
Here you can read online Heikin Ashi Trader - Swing Trading using the 4-hour chart 1-3: 3 Manuscripts full text of the book (entire story) in english for free. Download pdf and epub, get meaning, cover and reviews about this ebook. year: 2018, publisher: DAO Press, genre: Business. Description of the work, (preface) as well as reviews are available. Best literature library LitArk.com created for fans of good reading and offers a wide selection of genres:
Romance novel
Science fiction
Adventure
Detective
Science
History
Home and family
Prose
Art
Politics
Computer
Non-fiction
Religion
Business
Children
Humor
Choose a favorite category and find really read worthwhile books. Enjoy immersion in the world of imagination, feel the emotions of the characters or learn something new for yourself, make an fascinating discovery.
- Book:Swing Trading using the 4-hour chart 1-3: 3 Manuscripts
- Author:
- Publisher:DAO Press
- Genre:
- Year:2018
- Rating:3 / 5
- Favourites:Add to favourites
- Your mark:
Swing Trading using the 4-hour chart 1-3: 3 Manuscripts: summary, description and annotation
We offer to read an annotation, description, summary or preface (depends on what the author of the book "Swing Trading using the 4-hour chart 1-3: 3 Manuscripts" wrote himself). If you haven't found the necessary information about the book — write in the comments, we will try to find it.
Heikin Ashi Trader: author's other books
Who wrote Swing Trading using the 4-hour chart 1-3: 3 Manuscripts? Find out the surname, the name of the author of the book and a list of all author's works by series.


Swing Trading using the 4-hour chart 1-3: 3 Manuscripts — read online for free the complete book (whole text) full work
Below is the text of the book, divided by pages. System saving the place of the last page read, allows you to conveniently read the book "Swing Trading using the 4-hour chart 1-3: 3 Manuscripts" online for free, without having to search again every time where you left off. Put a bookmark, and you can go to the page where you finished reading at any time.
Font size:
Interval:
Bookmark:
Swing Trading Using the 4-Hour Chart
3 Manuscripts:
Book 1: Introduction to Swing Trading
Book 2: Trade the Fake!
Book 3: Where Do I Put my Stop?
Heikin Ashi Trader
DAO PRESS
Table Of Contents
Book 1: Introduction to Swing Trading
1. Why Swing Trading?
2. Why Should You Trade Using The 4-Hour Chart?
3. Which Markets Are Suitable For Swing Trading?
4. What Instruments You Can Swing Trade?
5. Swing Trading Setups
A. Support And Resistance
B. Double Top And Double Bottom
C. Breakouts
D. Flags And Pennants
6. Money Management
7. Why You Need A Trading Diary
8. What Is It All About?
Glossary
Book 2: Trade the Fake!
1. A feint at its finest!
2. How to identify fakes?
3. How do I trade Fakes?
4. Fakes at technical chart patterns
A. flags
B. triangles
C. Trend Channels
5. Trading cross rates
6. More complex patterns
Glossary
Book 3: Where Do I Put my Stop?
1. Are Stops Necessary?
2. What Is a Stop Loss Order?
3. Stop Management
4. Play Your Own Game
5. Cut Your Losses
6. And Let your Profits Run
7. Stop Management in Trending Markets
8. Stop Management with Price Targets
9. The Swiss Franc Tsunami, a Healing Moment of the Trader Community
10. How Many Positions Can I Keep at the Same Time?
Glossary
More books by Heikin Ashi Trader
About the Author
Imprint
Part 1: Introduction to Swing Trading
1. Why Swing Trading?
Most newcomers to the stock market try their luck with day trading. By this, is not saying anything wrong. You can earn a lot of money indeed with day trading if you are good at it. IF! The problem is that many aspiring traders significantly underestimate the difficulties in day trading. I just list a few on:
In this short timeframe you are competing with hundreds of thousands (mostly young) traders who are very well trained and equipped with the most advanced technology possible.
A quite significant competition you can expect from the so-called algorithms. In other words, you fight expensive computer programs that were developed by the best minds.
More competition you can expect from the lack of volatility in recent years. It happens more often that the typical trading markets, such as the E-mini, mini Dow future, EUR/USD and crude oil go sideways all day only to suddenly make a big jump without warning. Do you have the right position at this very moment?
Your biggest competitor is not at least yourself . Do not underestimate the psychological pressure when day trading. Many traders have run aground using this method. Even if you have a moment of success, it does not mean that this must always be so.
If in spite of these drawbacks you still want to day trade; then go for it!
Unlike day trading, position trading with daily charts or even weekly charts is a much more comfortable way to make money in the stock market. And, frankly, I would recommend most people to use this method.
But beware! Again, there is also a lot of competition, here! Here you have to compete with the major operators: investment funds, insurance companies and hedge funds that speculate in medium-term time frame with stocks, indices, commodities and currencies.
Those highly capitalized pools could, for example, have the idea to sell in large numbers the stock you just bought. Not because the stock has suddenly become bad. It could be, for example, that they need money for another investment. Or, they need it in order to pay their disgruntled customers. You see, even "investing" is not that simple. You may as well call the stock market a snake pit and you would not even be in the least, exaggerating. Is there no alternative?
I think there is. This alternative I call swing trading. It is a style of trading that takes place in a timeframe that is too slow for day traders and too fast for investors. In other words, in this timeframe, there are very few professionals trading. You will also hear nothing about it in the press. When was the last time you ever read an interesting article in the newspaper about swing trading? Probably never...
What timeframe do I mean? The charts that swing traders usually use are hour charts, or even better, 4-hour charts. In some cases, swing traders also work with daily charts. This is a period which falls between the investor and the day trader. You sit as if between the chairs, and that's good, because here you are almost alone.
2. Why should you trade using the 4-hour chart?
There are good reasons to work with the 4-hour chart. The smaller time frame, such as the 5-minute chart or 15-minute chart (typical of the day traders), are not representative of the Money Flow. What the big money does, you do not see here. However, you can clearly see it on the 4-hour chart. A technical pattern has a much higher information value here. This indicates rather, who controls the market at the moment: the bulls or the bears. You want to know this as a trader, right?
Unlike most other traders who like to work with candlestick charts, I use the heikin-ashi chart. This chart type has several advantages: The trend is more visible thanks to the visual smoothing of the candles (unlike Candlesticks). The strength of the trend is visible by the size of the candle and the occurrence of pins (long shadows above or below the body of the candle).
In other words, the heikin-ashi charts illustrate the imbalance between supply and demand very well and even show the inflection points clearly. Thus, they are an excellent tool to identify the capital flows in the markets. The example below from the Dow Jones index illustrates this.
Figure 1: Dow Jones, 4-hour chart, HeikinAshi
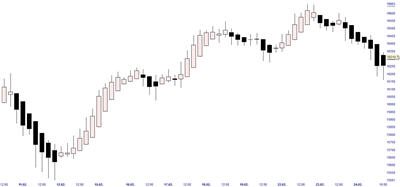
The 4-hour chart shows the "swings" very clearly. Those movements usually last a few days. Upswings (white, rising candles) and downswings (black, falling candles) are clearly seen in this example of a HeikinAshi chart. To illustrate this, I will show you now the same segment of the Dow Jones index in the candlestick representation:
Figure 2: Dow Jones Index, 4-hour chart, candlestick
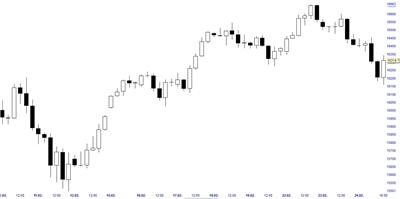
I hope you can see the difference. Of course, you can work well with the candlestick charts. But, I prefer the visual presentation of the HeikinAshi chart against that of the candlesticks. I like it when I can detect at first glance whether a market is in an uptrend or a downtrend.
On candlestick charts you will often get contradictory signals. In an uptrend, suddenly black candles could appear that could give the trader the impression that the trend is over. Such false signals are mostly filtered out on the HeikinAshi chart. This is an advantage not to be underestimated.
This example also shows very clearly what experienced traders know for a long time: market movements usually last 3 to 5 days. After the market has had a rally for 5 days, it mostly calms down again. It then forms a consolidation or sideways movement.
In the above example, the upward movement took place in three waves that you can identify very well thanks to the white candles in the HeikinAshi chart. These waves lasted about 24 hours (or eight 4-hour candles). The intermediate correction phase (usually black candles) also lasted about eight candles. Overall, this movement took the Dow Jones five days. For three days, the Dow was in an upward motion and two days in a correction movement. This pattern you will see over and over again.
Next pageFont size:
Interval:
Bookmark:
Similar books «Swing Trading using the 4-hour chart 1-3: 3 Manuscripts»
Look at similar books to Swing Trading using the 4-hour chart 1-3: 3 Manuscripts. We have selected literature similar in name and meaning in the hope of providing readers with more options to find new, interesting, not yet read works.
Discussion, reviews of the book Swing Trading using the 4-hour chart 1-3: 3 Manuscripts and just readers' own opinions. Leave your comments, write what you think about the work, its meaning or the main characters. Specify what exactly you liked and what you didn't like, and why you think so.