How to trade the weekly Pivots
Just as in the two strategies with the round number (Part 1 of this series), I would like to present two strategies with weekly pivots. If you are not familiar with the concept of pivots, I will briefly explain what they mean.
Pivot points, or simply pivots, were originally developed by floor traders in the commodity markets, in order to determine potential turning points. A distinction is made between the pivot itself, and three resist and three support levels. The pivot is the pivotal point of the trading day. It is the average of the high, low and close prices of the previous trading day. If the forex pair is trading above the pivot, this generally indicates a bullish sentiment. Conversely, if the pair is trading below the pivot, pivot traders are bearish and are more likely to take short positions.
The three support and resistance levels, which are also calculated on the basis of the previous trading day, are also important. They serve the pivot trader as possible entry levels for trades, or as potential price targets.
Just as you can calculate pivot points on a daily basis, you can also calculate them on a weekly, or even on a monthly basis. Most trading platforms have already implemented them automatically. It takes a few clicks to install them on a chart.
Image 1: USDJPY, 4-hour chart, weekly pivots, 09.30 to 10.04. 2019
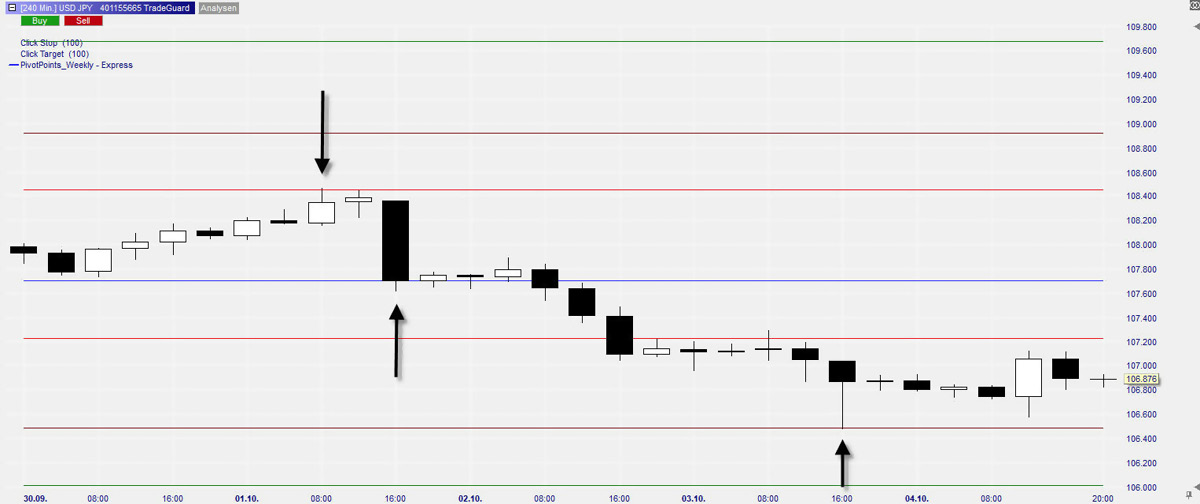
Image 1 shows the weekly pivots for the week from September 30 to October 4, 2019 in the USDJPY pair. The seven horizontal lines were automatically calculated by my broker platform, based on the closing data from the previous week. The middle line is the pivot itself. Above it, you can see the three resistances R1, R2 and R3. Below are the three support levels S1, S2 and S3.
As you can see, USDJPY first traded in the direction of the R1 level, and reached it quite accurately at around noon on October 1. It then dropped back to the weekly pivot in the afternoon. The next day, USDJPY was trading under the pivot and reached S1 in the afternoon and then dropped below that level. In the afternoon of October 3, USDJPY reached the S2 level.
Apart from the touch with S1 on October 2, the market turned pretty much exactly at each pivot level. Sometimes this happens exactly on a pip. Needless to say, as a trader you can take advantage of that.
The idea of the two pivot strategies I present here are similar to the round number strategies. I have simply adapted them to the concept of pivots. The weekly pivots, not the daily pivots!
Before we look at the strategies more closely, we should first look at an important aspect of pivot calculation.
Image 2: USDCAD weekly pivots from 09.30 to 10.18.2019
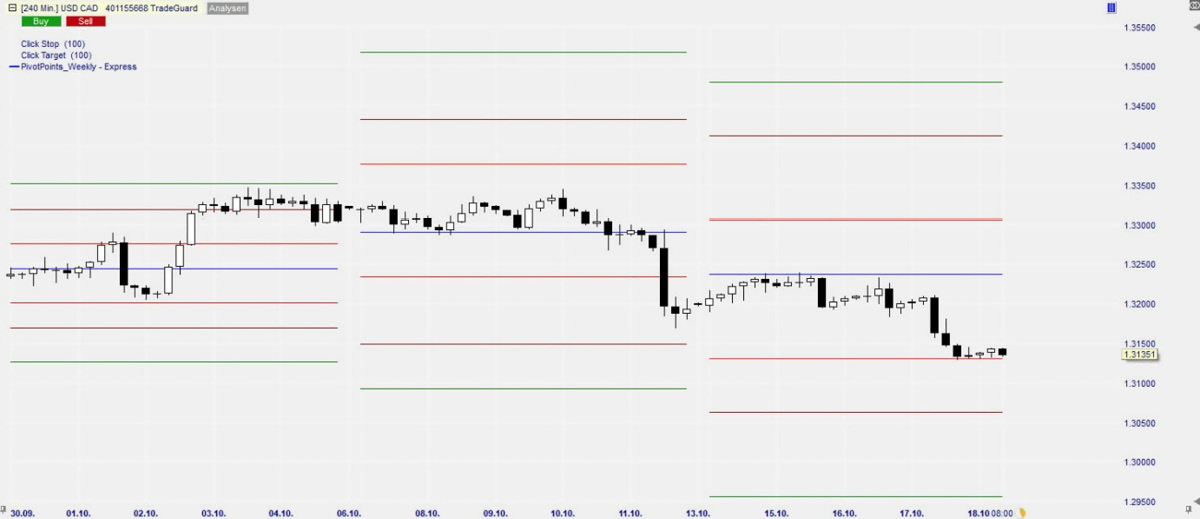
Take a closer look at Image 2. It shows the pivot lines for the three weeks from September 30 to October 18, for the USDCAD currency pair. It is easy to see that the pivot lines are close together in the week from 09.30 to 10.04 (on the left of the chart). The distance between the individual lines that week was barely 30 pips. It speaks for itself that scalping strategies aimed at targets of 15 or even 20 pips are difficult to implement here. We will see why this is so when we take a closer look at the two strategies.
In the week from 10.06 to 10.11 the levels were much wider. This was due to the fact that the volatility had suddenly increased in the previous week. And, because the new pivot lines are calculated on the basis of the closing data from the previous week, the pivot lines for the second week were much wider. Here, the distance between the pivot and the R1 was 87 pips. This is, of course, much better for trading. In the following week (week from 10.13 to 10.18) it was already over 100 pips.
So, the trader will have to adjust his price targets to these conditions if he wants to be successful with his scalping strategies. For example, it makes no sense to work with price targets of 20 pips if the distance between the pivot and R1 is only 40 pips. The two strategies will clarify the reason for this. If the distance is 87 pips, as in the second week in figure 2, price targets of 20 pips seem to make sense to me.
Another reason why the trader should avoid weeks with narrow pivot lines is the fact that pivots are often hardly noticed by market participants in such weeks. If you look at the first week in figure 2 again, you can see that USDCAD started a rally slightly above S1 on October 2, which took the pair almost to R3 within a few hours. On the way, the pair splashed the pivot, R1 and R2, and then almost reached R3. This is good when the trader is working with strategies that rely on reaching the pivot lines fast. Of course, it is not that good if he is aiming for the opposite.
In the first case, it seems to be favorable at first, because the market reaches the price target quickly. However, if you only have a range of 30 pips, the problem is to find a reasonable entry point. Where do you want to enter if the distance between the pivot and R1 is only 35 pips, especially if you are working with price targets of 15 or even 20 pips?
As a general rule, I would avoid ranges smaller than 60 pips. With 60 pips you can at least work with price targets of 15 pips, because they correspond to of the range. That makes sense in my eyes. I wouldnt touch anything underneath that.
Most pivot traders in Forex work with daily pivots. That is, with pivot levels that are calculated every day, on the basis of the price data of the previous day, although strictly speaking there is no such thing in Forex. Reason enough for me not to do this. I prefer to trade the weekly pivots, mainly because I feel they are more reliable than the daily pivots. By this, I mean that the levels that were built based on the previous weeks data are more likely to be considered by the big players than the levels of the previous day.
Thus, the two strategies try to trade short-term trades based on medium-term data. This may sound rather unorthodox to some traders, but we will see from the examples that such an approach can be quite profitable.
Strategy 1: Trade the Pivot
This strategy is a variation of the first strategy with the round number, but here, we apply it to the weekly pivots. As the example in Figure 1 clearly shows, market participants tend to respect weekly pivot levels at the first touch . And the remark at the first touch is therefore significant. The trader should only trade the first touch. He can safely refrain from further touches with the same pivot line.
In three of the four cases in Figure 1, the market reached the pivot level almost exactly, whereupon the market turned in the other direction. We want to take advantage of this fact in this strategy, by placing limit orders at the pivot levels and speculating on a countermove of 15 pips. Again, we use bracket orders, where, once the trade has been executed, an automatic stop order and an automatic take profit order become active in the market. So nothing is left to chance. Again, the parameters are clear and easy to understand. We set a price target of 15 pips with a risk of 15 pips as well. This means that we are working with a risk-reward ratio of 1:1. That said, the strategy must achieve a hit rate higher than 50% in order to be profitable. First of all, lets look at an example of the strategy.
Figure 3: USDCAD, 15-minute chart, October 7, 2019


