Stock Market
Investment
Made Easy
Harold Watt
AuthorHouse LLC
1663 Liberty Drive
Bloomington, IN 47403
www.authorhouse.com
Phone: 1-800-839-8640
2013 Harold Watt. All rights reserved.
No part of this book may be reproduced, stored in a retrieval system,
or transmitted by any means without the written permission of the author.
Published by AuthorHouse: 11/04/2013
ISBN: 978-1-4918-2825-0 (sc)
978-1-4918-2826-7 (e)
Library of Congress Control Number: 2013919433
Because of the dynamic nature of the Internet, any web addresses or links contained in this book may have changed since publication and may no longer be valid. The views expressed in this work are solely those of the author and do not necessarily reflect the views of the publisher, and the publisher hereby disclaims any responsibility for them.

Table of Contents
Understanding
The
Basics of the
Stock Market
DISCLAIMER
This book and all materials are designed to provide the reader with a basic understanding of the stock market. It is for educational and information purposes only. All stock trading involves risk. All decisions made to buy a stock are personal, and should be made after thorough research. The companys products, training, and coaching are for training purposes only. The company does not offer legal advice, accounting, or any other professional opinions. We do not solicit or recommend that you buy or sell any stock. If legal advice or any other expert assistance is needed, you should seek the services of a competent professional. This company is not liable in any way or form. You should consult a licensed broker or a registered investment advisor before buying any stock.
This book was written to help those who have an interest in playing stock market become more knowledgeable. It presents basic concepts to help you better understand the stock market and how it works. Although the stock market can appear very complex at first glance, anyone can do well in the market when taught how. In this book you will learn how to play the market which should eliminate any fear that prevents most people from ever trying. You will learn about fundamental and technical analysis, when to buy a stock and when to sell, the importance of market direction (uptrend, downtrend or correction), support and resistance, moving averages and stop losses. At the end of this book you should have the confidence to get started. You should also know how to increase your chances of success with the knowledge that you will attain while reducing your risk. I hope that you will continue to expand your knowledge in the world of investing. I would also like to wish you great success.
A stock certificate (aka certificate of stock or share certificate) is a legal document that certifies ownership of a specific number of shares of stock within a corporation. In large corporations, buying shares will not always lead to a stock certificate (this usually occurs when a small number of shares are purchased by an individual).
Here in the United States, companies are no longer required to issue paper stock certificates. In fact more than 400 of the many publicly traded companies do not issue stock certificates. All transactions or trading (buying and selling) is done through an on-line broker or brokerage firm. There are several brokers to choose from but the easiest way is to set up an account with one of the on-line brokers. We will discuss brokers in a later chapter. The goal here is to give a better understanding of what a stock or stock certificate is.
Psychology (is defined as the mental behavior of an individual or group) plays a major role in the market. It can change the markets direction (at any given time) in a matter of minutes. There are two psychological factors that rule the market, Fear and Greed. The stock market feeds off of these two emotions. Greed is an emotion that can cost you dearly (if you are not careful) when playing the stock market. There are countless investors who have lost fortunes because they allowed greed to take over. A good investor knows when to take his/her profits (or lock in their profits). I will show you how (stop losses) in a later chapter.
Fear; Fear is an emotion that can paralyze you and prevent you from taking action. It can also be defined as False Evidence Appearing Real . Fear can and will set in after a loss or a change in the markets direction. There will be times when you have done everything right and the market changes direction on you. When this happens (and it will happen) you cannot let fear set in. You minimize your losses and you wait for the next opportunity. Once you learn how to analyze the market (as well as your stock) you will know when to get in and when to sit on the side line. We are all subject to greed and fear but learning to control our emotions will lead to great success when playing the stock market.
What is fundamental analysis? Fundamental analysis involves analyzing the financial statements or health of a business. It involves looking at the management and any competitive advantages that a company might have (such as new products or services). Examples of a companys fundamentals (terms you should know) would be but not limited to, earnings per share, relative strength, sales and profit margin, return on equity, current earnings, annual earnings ,
Earnings per share (EPS) is the amount of earnings for each outstanding share of a companys stock. In essence you want to see at least a 20% or greater increase in EPS of a companys stock over the last 3 to 4 quarters .
Relative Strength (RS) is a widely used indicator that measures the stocks price against past performance. The values range from 0-100. A value of >80 indicates that a stock is overbought. A value of < 20 indicates that a stock is oversold (possibly a buy opportunity).
Sales is how much product or services a company has sold. You would like to see at least at least a 20% increase in sales over the past 3to 4 quarters.
Profit Margin measures how much out of every dollar of sales a company actually keeps in earnings. You want to see at least a 15% or higher profit margin.
Return on Equity measures a companys profitability by showing how much profit a company generates with the money share holders have invested. When doing your research, you want to see at least 20% in return on equity.
Current Earnings are the earnings most recently reported by a corporation, which exclude tax and interest. Once again you want to see at least a 20% increase over the last 3 to 4 quarters.
Annual Earnings are the yearly earnings reported by a corporation which exclude tax and interest. Again you want to see at least a 20% or greater increase over the past three years.
What is technical analysis ? Technical analysis is the charting of stock trading information used to predict the future trading action of any particular stock. Technical analysis is almost completely visual. An investor needs to know how to recognize and understand a charts action or direction. We will begin with the basics; charts, patterns, Indicators and trends.
Chart
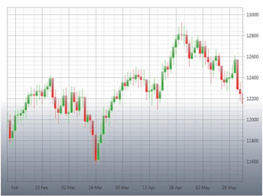
Candle sticks charts, line charts and mountain charts are used to view a stocks trading range. It tells you how much the stock is or has traded for in the past. The line chart (represented as a zig zag line on the chart) gives a general idea of the trading range for a particular stock. The mountain chart (which looks like a figure of a mountain on the chart) also gives you very limited information about the trading range. Unfortunately neither of the give you enough information about the stocks daily activity.
My personal preference is the candle stick. The candle stick tells you exactly how much the stock is trading for on any given day or week. The candle stick has three parts, the wick, the body and the tail. T he wick (which is the stem at the top of the candle) tells you how high the stock has moved that day: The body (or the middle) tells you the price the stock opened that day (bottom) and how much the stock closed that day(top). The body is reversed when the stock has declined for the day.
Next page
