The Millionaire Stock Trader
By Wong Yee
Ebook Edition
http://www.wongyee.org/
All Rights Reserved. No part of this publication may be reproduced or copied in any form or by any means - graphic, electronic or mechanical, including photocopying, recording, taping or information retrieval systems - without written permission of Rank Books.
Disclaimer: While every reasonable care is taken to ensure the accuracy of information herein, no responsibility can be accepted for any loss or inconvenience caused by any error or omission. The ideas, suggestions, general principles, examples and other information presented here are for reference and educational purposes only. This ecourse is not in anyway intended to give investment advice or recommendations to trade. The author or publisher shall have no liability for any loss or expense whatsoever relating to investment decisions made by the reader.
Main Menu
About Wong Yee
Wong Yee is a chartist, strategist, seminar speaker, lecturer and author based in Malaysia. He has spent over 38 years doing research in the characteristic behavior of global stock markets, and has written seven books on stock market analysis. He was the first local chartist who introduced RSI (Relative Strength Indicator) in his book The Trend Principle in 1986. His latest book You Too Can Be Rich in stock market investment introduces a new formula developed by Wong Yee on predicting Index or stock price targets with 90% accuracy.
Wong Yee was a dealer with UOB Kay Hian, a leading stock broking company in Singapore from 1982 to 2002. Currently, he is focusing on trading, writing books and he also provides consultation and training on stock market strategies. He has developed a simple, effective and proven system that can help investors to make bigger profits with smaller risks.
How do you really make money in the stock market?
The answer is all about your timing of your entry and exit. You need to have some foresight to know when to get into the market and get out when the party is over. While it is impossible to catch the exact bottom to buy and sell at the exact top, a little foresight will give you an edge to achieve the success for your stock trading.

In Singapore, we have seen great plays in many stocks such as Genting SP which share price rose from a mere S$0.40 to S$2.35 and TT International from S$0.007 to S$0.205 during the period 28.10 2008 to 9.11.2010 and 29.12.2011 to 25.4.2012 respectively.
Did you manage to buy them at their lows and sell when the share prices reached their tops? What if there is a trading method that allows you to do just that?
In this Ecourse, you will learn my unique trading methodology that will give you that foresight to pick stocks like Genting SP and TT International and bring you closer to the reality of making millions in the stock market.
I will give you clear and specific steps on this trading method and guide you along with examples and charts to show you how easy it is to implement this trading method.
This is not just a simple trading strategy that anyone can use but one with a high probability of success to give you the profits that you want. Although, I am using Singapore stocks and Malaysian stocks as examples in this Ecourse, this same trading methodology can be applied to foreign stocks such as Hong Kong stocks or the US stocks after you have mastered it.
My mentor, Dr Chan Chin Cheung, ex Chairman of Multi-Purpose Holdings Bhd and ex director of Sime Darby Bhd and many other listed companies, once said:
To be successful you need 99 per cent hard work and one per cent luck. Wise words indeed. The hard work for you is to learn everything I am going to teach you in this Ecourse and practice the method over and over again until you master this trading method.
In order to apply this trading methodology, you need to understand about price movement. A stock price when it starts to fall will continue to fall for a period of time. It will not fall in a straight line, but it will fall and rebound (also known as a pull back) and then it falls further (see diagram). The same thing applies when it is an uptrend, it does not rise in a straight line but instead, it rises, and then retraces (pullback) and then it goes up higher and so on.
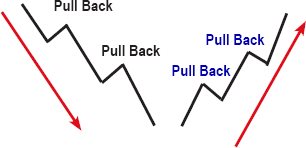
The application of this trading strategy is not to buy immediately when price starts to fall but to wait till the price has fallen significantly till it reached a bottom. What defines a bottom? How do we know that price has fallen enough and reached a bottom? I will define the criteria for this in later section. When a bottom is defined, we will look out for a buy signal and then enter the market. What defines a Buy Signal I will give the steps later.
If we are right and the stock price starts to rise, we will then use a method which I termed the Mystic 7 Formula to calculate 5 projected price points for possible exits or price targets. At the same time, we will be looking for any sign of tops resistance which may signal to us that the stock price is losing its upside momentum and may start to fall coupled with specific sell signals.
In summary, the 7 key steps to my trading methodology is as follows:
| Step 1: | Look for a stock which price has bottomed out |
| Step 2: | Look for the BUY signal and confirms it |
| Step 3: | Buy the stock |
| Step 4: | Estimate the Upside Targets using the Mystic 7 Formula |
| Step 5: | Look out for Tops Resistance |
| Step 6: | Look for the SELL signal and prepare to sell the stock |
| Step 7: | Sell the stock and take profit |

Step 1:
Look for a stock which price has bottomed out

Step 1A:
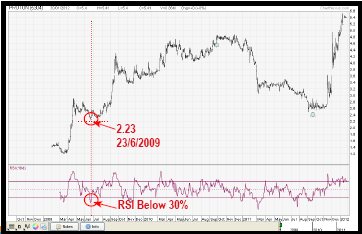
Look for the stock which price has fallen significantly. You can do this by using the Relative Strength Indicator (RSI). The RSI indicator must below 30% reading.
Important Note : The RSI indicator is set to 18 days instead of the default RSI setting of 14 days used by most traders or charting software. If you have your own charting software, remember to set the RSI to 18 days.
A RSI reading of below 30% gives us an indicator of a market bottom suggesting an opportunity is in sight after the price of the stock has fallen sharply. It indicates the opportunity for an imminent rebound and it could be the start of a new uptrend. However, do note that when the RSI is below 30% it may not mean an oversold situation as during panic selling, prices could fall further for days with no sign of rebounding.
Example :
The Proton chart is an example: Notice that after falling to RM 2.23 on 23.6.2009 where RSI is below 30%, Proton share price rebounded to RM2.54 on 26.6.2009.
An RSI reading of above 70% would just indicate that certain stock has more demand than supply. Prices could keep rising for days. Let us move on to the next step.

Next page





![Ryan Mallory [Ryan Mallory] - The Part-Time Trader: Trading Stock as a Part-Time Venture, + Website](/uploads/posts/book/124134/thumbs/ryan-mallory-ryan-mallory-the-part-time-trader.jpg)

