A Note for Early Release Readers
With Early Release ebooks, you get books in their earliest formthe authors raw and unedited content as they writeso you can take advantage of these technologies long before the official release of these titles.
This will be the Preface of the final book. Please note that the GitHub repo will be made active later on.
If you have comments about how we might improve the content and/or examples in this book, or if you notice missing material within this chapter, please reach out to the editor at vwilson@oreilly.
Picture yourself as a young data scientist whos just starting out in a fast growing and promising startup. Although you havent mastered it, you feel pretty confident about your machine learning skills. Youve completed dozens of online courses on the subject and even got a few good ranks in prediction competitions. You are now ready to apply all that knowledge to the real world and you cant wait for it. Life is good.
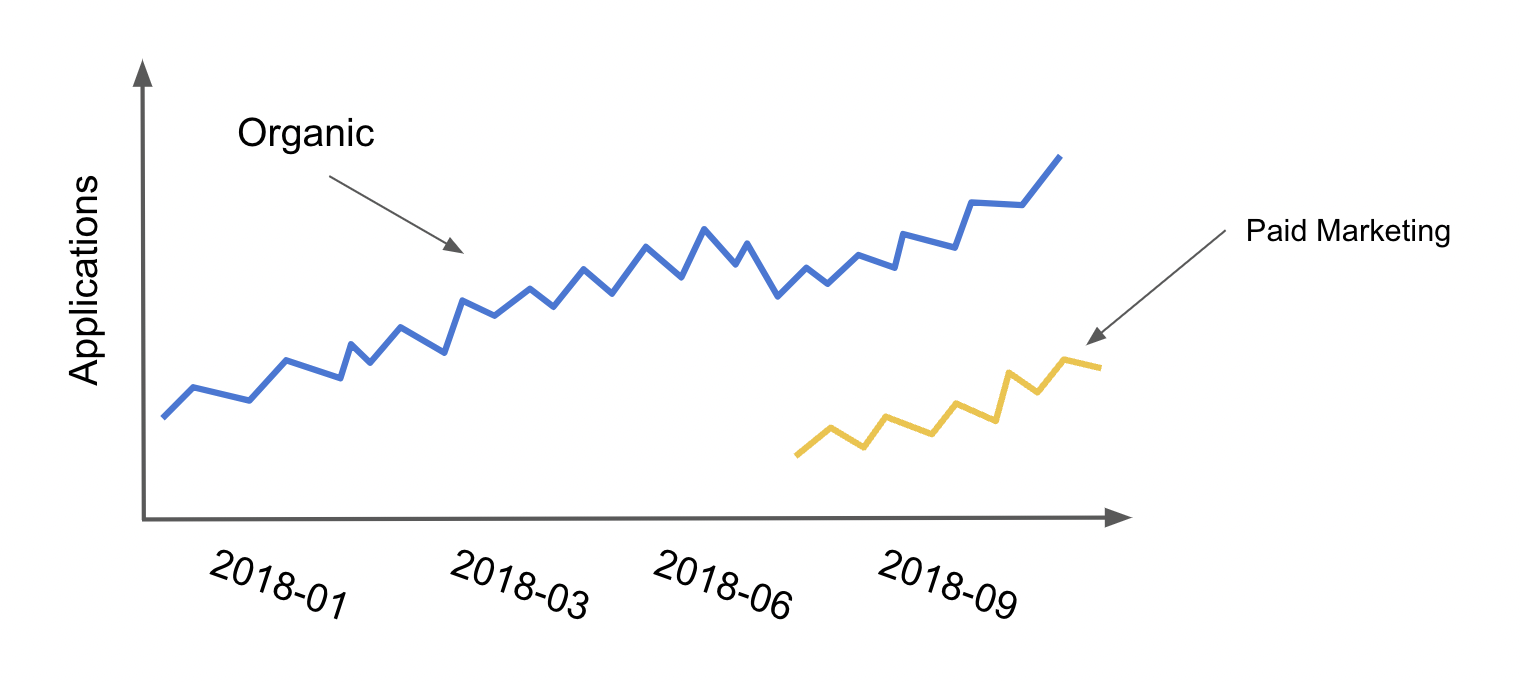
Then, your team lead comes with a graph which looks something like this
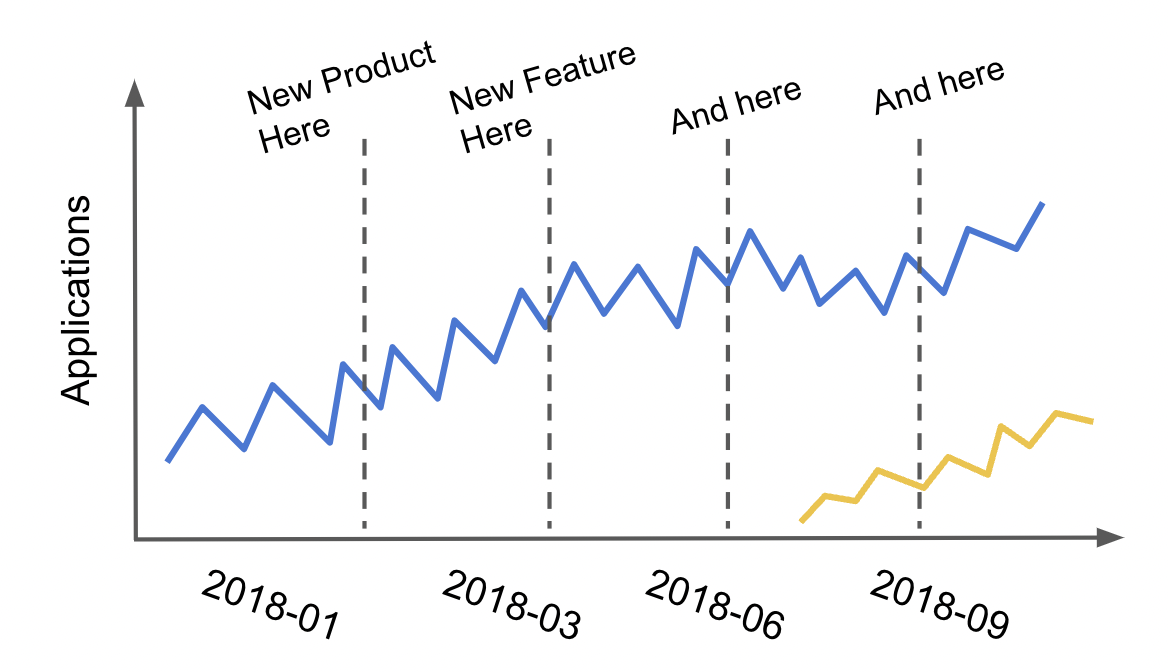
and an accompanying question: Hey, we want you to figure out how many additional customers paid marketing is really bringing us. When we turned it on, we definitely saw some customers coming from the paid marketing channel, but it looks like we also had a drop in organic applications. We think some of the customers from paid marketing would have come to us even without paid marketing.. Well, you were expecting a challenge, but this?! How could you know what would have happened without paid marketing? I guess you could compare the total number of applications, organic and paid, before and after turning on the marketing campaigns, but in a fast growing and dynamic company, how would you know that nothing else changes when they turn on the campaign?
Changing gears a bit (or not at all), place yourself in the shoes of a brilian risk analyst. You were just hired by a lending company and your first task is to perfect their credit risk model. The goal is to have a good automated decision making system which reads customer data and decides if they are credit worthy (underwrites them) and how much credit the company can lend them. Needless to say that errors in this system are incredibly expensive, especially if the given credit line is high.
A key component of this automated decision making is understanding the impact more credit lines have on the likelihood of customers defaulting. Can they all manage a huge chunk of credit and pay it back or will they go down a spiral of overspending and crippling debt? In order to model this behavior, you start by plotting credit average default rates by given credit lines. To your surprise, the data displays this unexpected pattern
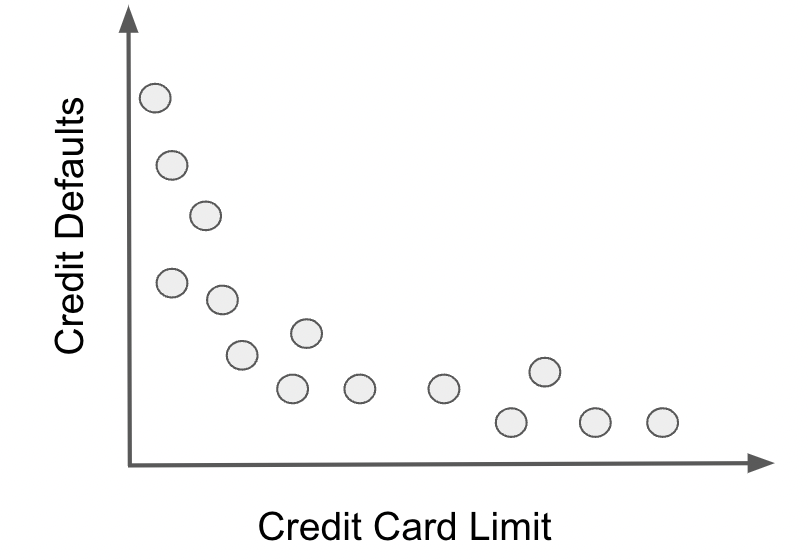
The relationship between credit and defaults seems to be negative. How come giving more credit results in lower chances of defaults? Rightfully suspicious, you go talk to other analysts to understand this. Turns out the answer is very simple: to no ones surprise, the lending company gives more credit to customers that have lower chances of defaulting. So, it is not the case that high lines reduce default risk, but rather, the other way around. Lower risk increases the credit lines. That explains it, but you still havent solved the initial problem: how to model the relationship between credit risk and credit lines with this data? Surely you dont want your system to think more lines implies lower chances of default. Also, naively randomizing lines in an A/B test just to see what happens is pretty much off the table, due to the high cost of wrong credit decisions.
What both of these problems have in common is that you need to know the impact of changing something which you can control (marketing budget and credit limit) on some business outcome you wish to influence (customer applications and default risk). Impact or effect estimation has been the pillar of modern science for centuries, but only recently have we made huge progress in systematizing the tools of this trade into the field which is coming to be known as Causal Inference. Additionally, advancements in machine learning and a general desire to automate and inform decision making processes with data has brought causal inference into the industry and public institutions. Still, the causal inference toolkit is not yet widely known by decision makers nor data scientists.
Hoping to change that, I wrote Causal Inference for the Brave and True, an online book which covers the traditional tools and recent developments from causal inference, all with open source Python software, in a rigorous, yet light-hearted way. Now, Im taking that one step further, reviewing all that content from an industry perspective, with updated examples and, hopefully, more intuitive explanations. My goal is for this book to be a startpoint for whatever questions you have about decisions making with data.
Prerequisites
This book is an introduction to Causal Inference in Python, but it is not an introductory book in general. Its introductory because Ill focus on application, rather than rigorous proofs and theorems of causal inference; additionally, when forced to choose, Ill opt for a simpler and intuitive explanation, rather than a complete and complex one.


