Rubber Band Stocks
A Simple Strategy for Trading Stocks
Matthew R. Kratter
www.trader.university
Contents
Copyright 2018 by Little Cash Machines LLC
All rights reserved. No part of this book may be reproduced in any form without written permission from the author (). Reviewers may quote brief passages in reviews.
For my wife and children
Disclaimer
Neither Little Cash Machines LLC, nor any of its directors, officers, shareholders, personnel, representatives, agents, or independent contractors (collectively, the Operator Parties) are licensed financial advisers, registered investment advisers, or registered broker-dealers. None of the Operator Parties are providing investment, financial, legal, or tax advice, and nothing in this book or at www.Trader.University (henceforth, the Site) should be construed as such by you. This book and the Site should be used as educational tools only and are not replacements for professional investment advice.
The author and the publisher disclaim responsibility for any adverse effects resulting directly or indirectly from information contained in this book.
The full disclaimer can be found at the end of this book.
Your Free Gift
Thanks for buying my book!
Many readers have been asking me how they can trade this strategy in a small account ($5,000 or less).
Others have asked if there is a way to use options to turbo-charge this trading strategy.
So I put together a quick bonus that answers both of these questions:
>>>Tap Here to Get the Free Bonus<<<
Or simply go to:
www.trader.university/rubber-band-stocks-second-edition
The Best Way to Learn How to Trade Stocks
W hats the best way to learn how to trade stocks?
Its actually quite simple:
Pick one specific trading strategy, and focus all of your time and attention on it.
Until you have mastered it.
Too often, new traders jump from one strategy to another.
They never stay in one place long enough to learn from their mistakes.
Or to learn from their winning trades.
The trading strategy that you are about to learn is simple, and yet extremely powerful.
Its a great strategy for anyone who is just getting started trading.
In this book, I will show you how to find the right stocks to trade, and then what to do once youve found them.
A final note before we get started:
When you are first learning how to trade, it is important not to focus on the money.
You should focus on only 3 things:
Your entry price
Your profit target
Your stop loss
If you can focus on just these 3 things, then the money will begin to take care of itself.
I know that this works, because thats what happened to me.
I first worked on perfecting my technique and discipline.
As these evolved, the money naturally followed.
Now its time to turn to the details of this powerful trading strategy.
A Sneaky Little Trick for Finding Stocks That Are Ready to Rally
W hen Warren Buffett tells us that we need to be greedy when others are fearful, he is really just saying that we need to buy stocks when others are selling stocks.
This sounds easy in principle, but how exactly do you do it in real life?
The Rubber Band Stocks strategy is one answer to this question.
When trading this strategy, I use Bollinger Bands which look like this:
You dont need to know exactly how Bollinger Bands are calculated for now.
All you need to know is that when a stock closes below the lower Bollinger Band, it should always get your attention.
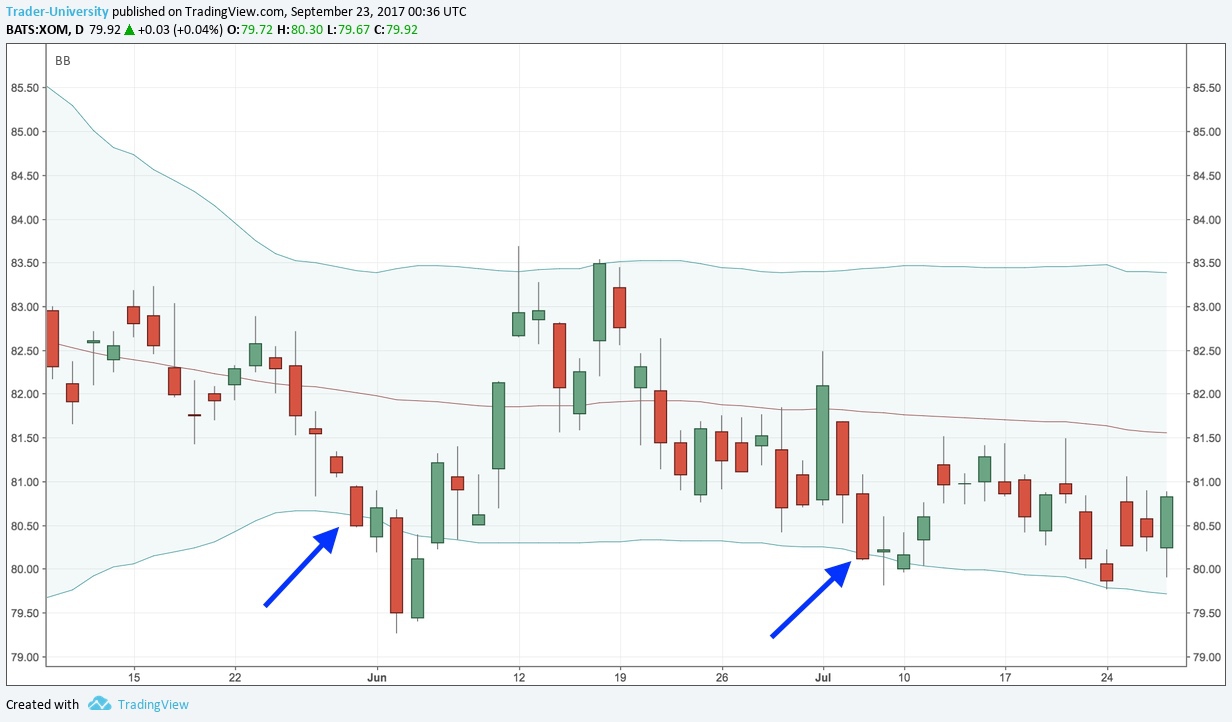
Here is a stock closing two different times below the lower Bollinger Band:
Each bar or candlestick represents one trading day.
If the candlestick is red, it means that the stocks closing price is lower than its opening price.
If the candlestick is green, it means that the stocks closing price is higher than its opening price.
The top of the wick shows the stocks daily high price, and the bottom of the wick shows the stocks daily low price.
Ive put 2 big arrows on the chart above to show you the days on which the stock closed below the lower Bollinger Band.
The bottom of the red part of the candlestick is the closing price.
Ive built a free chart that you can use with any stock here:
https://www.tradingview.com/chart/QxHMkmnE/
To use this chart, just enter a ticker in the upper right-hand box, press enter, and then double-click on the symbol to have it load on the chart.
You may need to sign up for a free account with TradingView.com in order to change the ticker in the chart.
(By the way, my only affiliation with TradingView.com is as a paying customer myself).
Here we are using daily bars, and we have set the Bollinger Bands to use an 80-period (80 days) look-back.
You will notice that the middle band is just an 80-day moving average.
The upper Bollinger Band is always two standard deviations above this moving average.
And the lower Bollinger Band is always two standard deviations below this moving average.
Under a normal distribution, approximately 95% of observations will fall between -/+ two standard deviations.
So if we close above the upper Bollinger Band, or below the lower Bollinger Band, its definitely a fairly rare event, and we need to wake up and take notice.
Readers often ask me why I use an 80-day period, rather than another setting.
The short answer is this:
I use it simply because (after a lot of experimentation) Ive found that it tends to work best in most market environments.
80 days is about 4 months of trading, since there are usually only about 20 actual trading days in every month.
There are lots of computers trading short time intervals, and lots of smart people investing over long time intervals.
It may be that the 4 month period is too long for the first group, and too short for the second group.
That leaves us to trade and profit from it.
You could certainly use a 75-day period, or 85-day period, and probably get similar results.
There is nothing magic about Bollinger Bands.
But they are especially useful for organizing data in a visual manner that our brains can quickly interpret.
As weve said, when a stock closes below the lower Bollinger Band, it should always get your attention.
A close below the lower band means one of two things:
The stock is ready to snap back up like a stretched rubber band; or
The stock is ready to trend downwards.
In order to get a stock to trade below the lower Bollinger Band, it takes an unusual amount of selling pressure.
Sometimes that selling pressure is justified, as in those cases where the stock is rapidly going to zero (think Enron or Lehman).
And sometime that selling pressure is not justified.
For example, investors may get spooked by reports of pink slime in McDonalds hamburgers, but McDonalds apologizes, moves on, and continues to print money.


