Table of Contents
Guide
Page List

To my wife, Faith; sons, Jonathan and Jeremy; daughters-in-law, Asia and Cheryl; brother, Allan; sister-in-law, Marilyn; and grandchildren, Jaiden, Jordan, Josiah, Luna, and Jayme; all of whom keep me focused on what is truly important in life.
Special thanks to Paul Buckley, Dawn Dentato, Lee Kucera, and Kenn Pendleton for their careful reading and thoughtful suggestions, and to Linda Turner, senior editor at Barrons, for her guidance.
About the Author
Dr. Martin Sternstein, Professor Emeritus at Ithaca College, is a long-time College Board Consultant and has been a Reader and Table Leader for the AP Statistics exam for many years. He has strong interests in national educational and social issues concerning equal access to math education for all. For two years he was a Fulbright Professor in Liberia, West Africa, after which he developed a popular Math in Africa course, and is the only mathematician to have given a presentation at the annual Conference on African Linguistics. He also taught the first U.S. course for college credit in chess theory. Dr. Sternstein and his wife live in a house they designed and built with their own hands with the help of many of the math faculty. They have five delightful grandchildren.
Copyright 2018 by Barrons Educational Series, Inc.
All rights reserved.
No part of this publication may be reproduced or distributed in any form or by any means without the written permission of the copyright owner.
All inquiries should be addressed to:
Barrons Educational Series, Inc.
250 Wireless Boulevard
Hauppauge, New York 11788
www.barronseduc.com
Library of Congress Control Number: 2018936456
ISBN: 978-1-5062-7206-1
PRINTED IN CANADA
9 8 7 6 5 4 3 2
Contents
MULTIPLE-CHOICE (QUESTIONS 1500)
| Exploratory Analysis (Questions 1125) |
| One-variable data analysis: (6368 mention normal) | Questions 168 |
| Two-variable data analysis: | Questions 69125 |
| Collecting and Producing Data (Questions 126200) |
| Sampling strategies: | Questions 126151 |
| Bias in sampling: | Questions 152169 |
| Experiments and observational studies: | Questions 170200 |
| Probability (Questions 201325) |
| Basic probability rules: | Questions 201233 |
| Binomial and geometric probabilities: | Questions 234250 |
| Random variables: | Questions 251273 |
| Normal probabilities: | Questions 274294 |
| Sampling distributions: | Questions 295325 |
| Statistical Inference (Questions 326500) |
| Confidence intervals for proportions: | Questions 326347 |
| Confidence intervals for means: | Questions 348369 |
| Confidence intervals for slopes: | Questions 370375 |
| Determining sample sizes: | Questions 376387 |
| Logic of significance testing: | Questions 388403 |
| Hypothesis tests for proportions: | Questions 404419 |
| Hypothesis tests for means: | Questions 420452 |
| Type I and II errors, power: | Questions 453472 |
| P-values from simulations: | Questions 473474 |
| Chi-square tests: | Questions 475494 |
| Hypothesis tests for slopes: | Questions 495500 |
FREE-RESPONSE (Questions 501600)
Although questions are organized into categories below, there is considerable overlap. Many, if not most, free-response questions, especially the ones under Statistical Inference, involve topics from throughout the course.
| Exploratory Analysis (Questions 501526) |
| One-variable data analysis: | Questions 501518 |
| Two-variable data analysis: | Questions 519526 |
| Collecting and Producing Data (Questions 527536) |
| Probability (Questions 537558) |
| Statistical Inference (Questions 559600) |
High stakes assessments can heighten anxiety and hinder learning. Frequent testing done right, however, can be an effective way to learn. Testing yourself with a few of these exercises every day will develop confidence, lead to quicker recall, and develop a deeper understanding of the material.
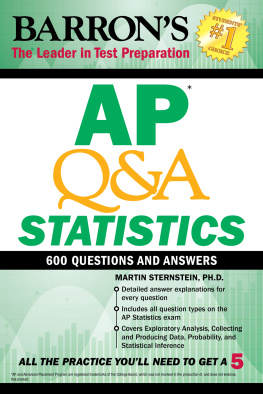
This study guide is designed as a quick source of practice exercises for problems seen on the AP Statistics Exam. It is fully up-to-date concerning the ongoing changes in topic emphasis and scoring guidelines of the exam. All of the problems are at the level of the AP Exam except for a very few starred (*) exercises, which are at a more challenging level. They are included to fully test your understanding. Whereas the focus of this book is practice exercises, Barrons publishes another book, Barrons AP Statistics, which develops, explains, and reviews each concept.
The AP Statistics Exam consists of a 90-minute section with 40 multiple-choice problems and a 90-minute section with six free-response problems (five open-ended questions and an investigative task). In grading, the two sections are weighted equally. The multiple-choice questions are more conceptual than computational. The free-response questions require communication skills as well as statistical knowledge. (Showing just the answer to a free-response problem will not receive full credit.)
The percentage of questions on the AP Statistics Exam from each content area is approximately 25% exploratory analysis, 15% collecting and producing data, 25% probability, and 35% statistical inference.
In this book are a total of 600 questions (500 multiple-choice and 100 free-response) for you to practice. Time yourself, allowing only 2 minutes for each multiple-choice question and only 13 minutes for each free-response question. When you read through a given multiple-choice answer, think just as hard about why the wrong choices are incorrect as about why the best choice is correct.
Certainly, doing an end-of-the-year review is worthwhile. However, if you attempt, think through, and master five multiple-choice and one free-response question every day during the school year, you will be in great shape to do well on the AP Statistics Exam in May. Of course, as long as you keep up a good weekly pace, dont forget to give yourself occasional well-deserved days off! Use the following question numbers, which are listed by content, to pick which correspond to where you are in your class work.
MULTIPLE-CHOICE
QUESTIONS
Answers for Chapter 1 are on . | CHAPTER
|

. One element in the dotplot above is labeled X. Which of the statements below is true?
(A) X has the smallest z-score, in absolute value, of any element in the set.
(B) X has the largest z-score, in absolute value, of any element in the set.
(C) X has the smallest value of any element in the set.
(D) A boxplot will plot X

