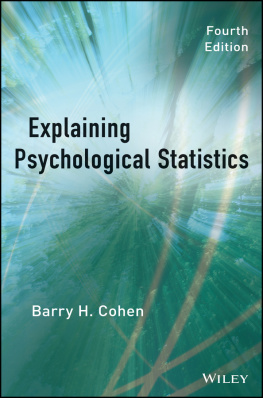
Cohen - Explaining Psychological Statistics
Here you can read online Cohen - Explaining Psychological Statistics full text of the book (entire story) in english for free. Download pdf and epub, get meaning, cover and reviews about this ebook. City: Hoboken;New Jersey, year: 2013, publisher: John Wiley & Sons, Incorporated, genre: Children. Description of the work, (preface) as well as reviews are available. Best literature library LitArk.com created for fans of good reading and offers a wide selection of genres:
Romance novel
Science fiction
Adventure
Detective
Science
History
Home and family
Prose
Art
Politics
Computer
Non-fiction
Religion
Business
Children
Humor
Choose a favorite category and find really read worthwhile books. Enjoy immersion in the world of imagination, feel the emotions of the characters or learn something new for yourself, make an fascinating discovery.
Explaining Psychological Statistics: summary, description and annotation
We offer to read an annotation, description, summary or preface (depends on what the author of the book "Explaining Psychological Statistics" wrote himself). If you haven't found the necessary information about the book — write in the comments, we will try to find it.
Explaining Psychological Statistics — read online for free the complete book (whole text) full work
Below is the text of the book, divided by pages. System saving the place of the last page read, allows you to conveniently read the book "Explaining Psychological Statistics" online for free, without having to search again every time where you left off. Put a bookmark, and you can go to the page where you finished reading at any time.
Font size:
Interval:
Bookmark:
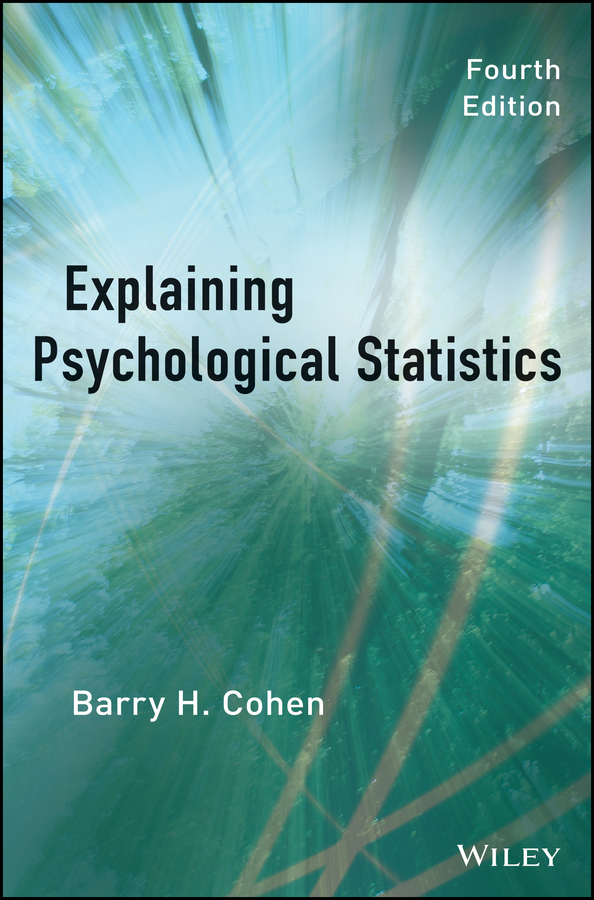
Cover images: landscape image iStockphoto.com/William Walsh
abstract swoosh image iStockphoto.com/Chung Lim Dave Cho
Cover design: Andy Liefer
This book is printed on acid-free paper.
Copyright 2013 by John Wiley & Sons, Inc. All rights reserved
Published by John Wiley & Sons, Inc., Hoboken, New Jersey
Published simultaneously in Canada
All screen capture images featured in Analysis by SPSS sections are reprinted courtesy of International Business Machines, International Business Machines Corporation.
No part of this publication may be reproduced, stored in a retrieval system, or transmitted in any form or by any means, electronic, mechanical, photocopying, recording, scanning, or otherwise, except as permitted under Section 107 or 108 of the 1976 United States Copyright Act, without either the prior written permission of the Publisher, or authorization through payment of the appropriate per-copy fee to the Copyright Clearance Center, 222 Rosewood Drive, Danvers, MA 01923, (978) 750-8400, fax (978) 646-8600, or on the web at www.copyright.com. Requests to the Publisher for permission should be addressed to the Permissions Department, John Wiley & Sons, Inc., 111 River Street, Hoboken, NJ 07030, (201) 748-6011, fax (201) 748-6008, or online at www.wiley.com/go/permissions.
Limit of Liability/Disclaimer of Warranty: While the publisher and author have used their best efforts in preparing this book, they make no representations or warranties with the respect to the accuracy or completeness of the contents of this book and specifically disclaim any implied warranties of merchantability or fitness for a particular purpose. No warranty may be created or extended by sales representatives or written sales materials. The advice and strategies contained herein may not be suitable for your situation. You should consult with a professional where appropriate. Neither the publisher nor the author shall be liable for damages arising herefrom.
For general information about our other products and services, please contact our Customer Care Department within the United States at (800) 762-2974, outside the United States at (317) 572-3993 or fax (317) 572-4002.
Wiley publishes in a variety of print and electronic formats and by print-on-demand. Some material included with standard print versions of this book may not be included in e-books or in print-on-demand. If this book refers to media such as a CD or DVD that is not included in the version you purchased, you may download this material at http://booksupport.wiley.com. For more information about Wiley products, visit www.wiley.com.
Library of Congress Cataloging-in-Publication Data:
Cohen, Barry H.
Explaining psychological statistics / Barry H. Cohen, New York University. Fourth Edition.
pages cm..(Coursesmart)
Includes bibliographical references and index.
ISBN 978-1-118-43660-8 (hardback : alk. paper)
ISBN 978-1-118-25950-4 (ebk.)
ISBN 978-1-118-23485-3 (ebk.)
ISBN 978-1-118-22110-5 (ebk.)
1. Psychometrics. 2. Psychology.Mathematical models. 3. StatisticsStudy and teaching
(Higher). I. Title.
BF39.C56 2013
150.15195dc23
2013028064
For Leona
Preface to the Fourth Edition
This edition marks the first time that I have included detailed instructions for the use of IBM SPSS Statistics (SPSS, for short) in the text itself, and not merely in supplemental material on the web. Not every instructor wants to teach SPSS as part of his or her statistics course, but such a large proportion of my adopters, and would-be adopters, do incorporate SPSS instruction in their courses that I felt it would greatly enhance the usefulness of my text to add a section on SPSS to every chapter. To keep the text down to a manageable size, I had to modify the ABC section format that I have used since the first edition of this text, as described next.
As in previous editions, Section A of each chapter provides the Conceptual Foundation for the topics covered in that chapter. In Section A, I focus on the simplest case of the procedure dealt with in that chapter (e.g., one-way ANOVA with equal-sized groups), and explain the definitional formulas thoroughly, so that students can gain some insight into why and how statistical formulas work the way they do. The emphasis is on the underlying similarity of formulas that look very different (e.g., it is shown that, in the two-group case, the MSW of a one-way ANOVA is exactly the same as the pooled-variance estimate in a two-group t test). In my experience, students learn statistics more easily when statistical formulas are not presented as arbitrary strings of characters to be memorized, or even just looked up when needed, but rather when the structures of the formulas are made clear (e.g., the sample size usually appears in the denominator of the denominator of the formula for the one-sample t test, which means that it is effectively in the numeratorso, making the sample size larger, with all else remaining the same, will increase the size of the t value). Some instructors may prefer an approach in which concepts are explained first without reference to statistical formulas at all. I don't feel I could do that well, so I have not attempted that approach in this text. However, I believe that all of the formulas in this text can be made understandable to the average graduate (or above-average undergraduate) student.
Section A has its own detailed summary, followed by exercises that help ensure that students grasp the basic concepts and definitional formulas before moving on to the complications of Section B. Section B, Basic Statistical Procedures, presents the more general case of that chapter's procedure and includes computational formulas, significance tests, and comments on research design so that students will be equipped to analyze real data and interpret their results. In addition to the basics of null hypothesis testing, Section B also includes supplementary statistical procedures (e.g., confidence intervals, effect sizes), and information on how to report such statistical results in the latest APA format, usually illustrated with an excerpt from a published journal article. Section B ends with a thorough summary and a variety of exercises so that students can practice the basic computations. Moreover, these exercises often refer to exercises in Section A of that chapter, or exercises from previous chapters, to make instructive comparisons (e.g., that a one-way RM ANOVA can be calculated on the same data that had been used to illustrate the computation of a matched t test).
In previous editions, Section C presented Optional Material that was usually more conceptually advanced and less central to students' needs than the topics covered in Sections A and B. In this edition, the former Section C material that was most relevant to the chapter has been incorporated in Section B, or in some cases in a separate section labeled Advanced Material, which does not appear in all chapters. The more specialized material from the previous C sections will be included in new supplements that I am preparing for each chapter, which will eventually be made available on the web. The new C Sections explain how to use SPSS to perform the statistical procedures in the B sections they follow. I have included some little-known, but useful, options that are available only by using a Syntax window (e.g., obtaining simple main effects from the two-way ANOVA procedure). I have also included explanations of SPSS's most important data management tools (e.g., Split File, Recode), spread across several C sections and illustrated in terms of the procedures of the chapter in which each is introduced.
Next pageFont size:
Interval:
Bookmark:
Similar books «Explaining Psychological Statistics»
Look at similar books to Explaining Psychological Statistics. We have selected literature similar in name and meaning in the hope of providing readers with more options to find new, interesting, not yet read works.
Discussion, reviews of the book Explaining Psychological Statistics and just readers' own opinions. Leave your comments, write what you think about the work, its meaning or the main characters. Specify what exactly you liked and what you didn't like, and why you think so.

