Introduction
Stars shredded into pieces and nearby planets boiling away are among the images conjured up by the word supernova. Shockwaves pound outwards and turn rocky asteroids into cometary fluff, driving planetary shards from their orbits and showering neighboring star systems with waves of deadly radiation. Its dramatic stuff. But what really happens inside the blast wave of a supernova, and, more importantly how can we explain all the different forms of explosion that are emerging from automated supernova searches? This book explores these violent and sometimes strange landscapes, populated by the corpses of tortured stars. Recent observations have revealed a wealth of new types of explosion, as well as illuminating the underlying mechanisms of how stars explode.
A traveler of any sort needs a map, a compass and some sort of focal point onto which new discoveries can be pinned. Astronomers employ a number of tools that return the information they require to describe and explain supernovae. This chapter is subdivided into sections that build one upon the other. From these modest beginnings we will emerge in a world like no other, a world of poetic death, schadenfreude and humbling sacrifice.
We begin our journey with the tools to navigate: stellar spectra, the Hertzsprung-Russell diagram, photometry and a brief guide to stellar structure and function.
Spectra: Chemical Portraits of Stars
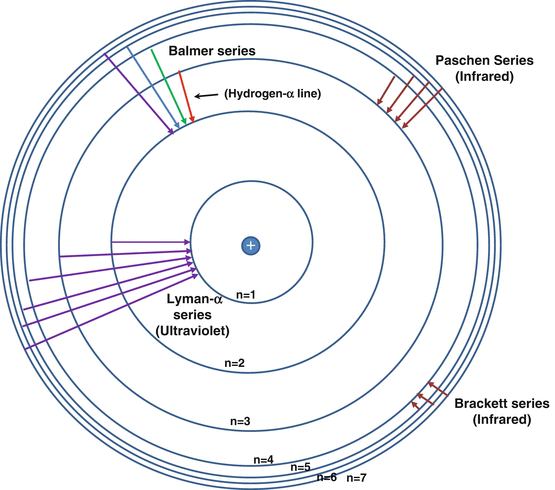
Spectroscopy can be thought of as the study of the chemistry of light. When white light is passed through a prism or diffraction grating the light is split into its respective colors. Each chemical element has a distinctive and unique spectroscopic signature. Although significantly lower in intensity than sunlight, starlight can also be split this way. The resulting spectrum gives a unique chemical signature for the star (Fig. ).
Fig. 1.1
Energy levels in a hydrogen atom. If electrons drop to the first level (n = 1) from the outer, higher energy levels they emit an ultraviolet photon. The well-known Balmer emission series (hydrogen-) is produced when electrons drop from upper level three to the lower second level. Corresponding upward movements generate absorption features
Spectra come in three broad flavors: absorption, continuous and emission. A continuous spectrum is a bland rainbow of color produced by a chemically mixed source of light such as the surface, or photosphere, of a star. Where the light passes through intervening material an absorption spectrum of dark bands, called Fraunhofer lines, are observed. Finally, where light is emitted by excited gas this light is broken into bright bands called emission spectra. Only the hottest stars or strongly irradiated gas produces emission lines. But what are these bands and how are they produced?
To answer this innocuous question we need to take a brief tour of the atom. In standard high school textbooks the atom is a Solar System in miniature, with planetary electrons orbiting a nuclear Sun. However, unlike planets whose orbits wobble and stretch, electrons experience an odd, restricted life. Electrons exist around the nucleus in specific energy levels or shells. Leaving aside the peculiarities of quantum physics, electrons remain in these shells with specific energies, unless they absorb or emit energy.
Now, not any energy will suffice. Electrons are picky. Thinking somewhat anthropomorphically, if the electron wants to move up one or more energy levels it must absorb a specific packet or quanta of energy a photon with the correct frequency.
The energy levels are separated by specific energy amounts, and the absorbed photon must match the energy if the electron is to hop up. The electron can also move down a level by emitting a photon of light. This photon will exactly match the difference in the energy of the levels the electron has traversed.
Given enough energy, the electron can shake free of its bonds and escape the atomic nucleus altogether. This process, called ionization, allows the electron the freedom to absorb subsequent photons with any energy.
Absorption of photons by electrons gives rise to the dark Fraunhofer lines. Each element has a unique set of protons and (in the neutral state) an equal number of electrons that characterizes the chemistry of that atom. Consequently, the movement of electrons between atomic shells formulates a unique signature of absorption or emission that is evident in the spectrum of the light source or gas through which the light traverses.
An observer examining the light from the star, peering through the cloud, will see these absorptions as an absorption spectrum. Conversely an astronomer able to observe the gas without interference from light directly from the parent star will see only the light emitted by the same electrons as they lose energy and drop back down energy levels. This will produce an emission spectrum. In reality on Earth we can see all three of these from the same object (or at least the vicinity of the illuminating object) by blocking out portions of starlight entering the telescopes spectroscope. The end result can be a detailed chemical portrait of the star and its surroundings. Knowledge of this sort is essential, as we shall see that some stars have a deft knack of shedding their skin as they age. In these evolutions, the pupal case is often as important as the beast that emerges from underneath as they reveal the inner workings of the star in the period running up to its death.
Conversely, atoms with very excited, energetic electrons can calm down by electrons leaping down energy levels and emitting photons of light that correspond to the difference in energy levels. These liberated photons constitute the building blocks of the emission spectra the bright lines on an otherwise dark background. Similarly, if light is emitted by a cloud of diffuse, hot gas it will also display emission lines. O-type stars, the hottest and most luminous in the universe, are sufficiently energetic to display emission lines corresponding to hydrogen and helium in their spectra. Any hydrogen or helium in their vicinity may also be ionized by the profuse emission of ultraviolet light from their surfaces. Consequently, the nebulae from which they form, and so frequently are associated with them, show prominent emission of hydrogen-alpha (Balmer) and Lyman-alpha lines and glow a profuse red. As a result O-type stars, buried within nebulosity and clusters of lesser stars, may be spotted over cosmological distances by the effect they have on nearby nebulosity. The Orion Nebula is perhaps the most famous nearby example powered by a small, tight cluster of O-type stars the Trapezium. Many others are known (Fig. ).

