MEAP Edition
Manning Early Access Program
Interpretable AI
Building explainable machine learning systems
Version 2
Copyright 2020 Manning Publications
For more information on this and other Manning titles go to
manning.com
welcome
Thank you for purchasing the MEAP edition of Interpretable AI.
With breakthroughs in areas such as image recognition, natural language understanding and board games, AI and machine learning are revolutionizing various industries such as healthcare, manufacturing, retail and finance. As complex machine learning models are being deployed into production, the understanding of them is becoming very important. The lack of a deep understanding can result in models propagating bias and weve seen examples of this in criminal justice, politics, retail, facial recognition and language understanding. All of this has a detrimental effect on trust and from my experience, this is one of the main reasons why companies are resisting the deployment of AI across the enterprise.
Explaining or interpreting AI is a hot topic in research and the industry, as modern machine learning algorithms are black boxes and nobody really understands how they work. Moreover, there is EU regulation now to explain AI under the GDPR right to explanation. Interpretable AI is therefore a very important topic for AI practitioners. There are a few resources available to stay abreast with this active area of research like survey papers, blog posts and a few books but there is no single resource that covers all the important techniques that will be valuable for practitioners. There is also no practical guide on how to implement these cutting-edge techniques.
This book aims to fill that gap by providing a simplified explanation of interpretability techniques and also a practical guide on how to implement them in Python using open, public datasets and libraries. The book will show code snippets and also share the source code for you to follow along and reproduce the graphs and visuals in the book. It is meant to be a hands-on book giving you practical tips to implement and deploy state-of-the-art interpretability techniques. Basic knowledge of probability, statistics, linear algebra, machine learning and Python is assumed.
I really hope you enjoy this book and I highly encourage you to post any questions or comments in the liveBook discussion forum. This feedback will be extremely useful for me to make improvements to the book and increase your understanding of the material.
Happy reading!
Ajay Thampi
1 Introduction
This chapter covers:
Different types of machine learning systems
How machine learning systems are typically built
What is interpretability and why is it important
How interpretable machine learning systems are built
Summary of interpretability techniques covered in this book
Welcome to this book! Im really happy that you are embarking on this journey through the world of Interpretable AI and I look forward to being your guide. In the last five years alone, we have seen major breakthroughs in the field of Artificial Intelligence (AI) especially in areas such as image recognition, natural language understanding and board games like Go! As critical decisions are being handed over to AI in industries like healthcare and finance, it is becoming increasingly important that we build robust and unbiased machine learning models that drive these AI systems. In this book, I wish to give you a practical guide on interpretable AI systems and how to build them. Through a concrete example, this chapter will motivate why interpretability is important and will lay the foundations for the rest of the book.
1.1 Diagnostics+ AI An Example AI System
Lets now look at a concrete example of a healthcare center called Diagnostics+ that provides a service to help diagnose different types of diseases. Doctors who work for Diagnostics+ analyze blood smear samples and provide their diagnosis which can be either positive or negative. This current state of Diagnostics+ is shown in Figure 1.1.

Figure 1.1: Current State of Diagnostics+
The problem with the current state is that the analysis of the blood smear samples is done manually by the doctors. With a finite set of resources, diagnosis therefore takes a considerable amount of time. Diagnostics+ would like to automate this process using AI and diagnose more blood samples so that patients get the right treatment sooner. This future state is shown in Figure 1.2.

Figure 1.2: Future State of Diagnostics+
The goal for Diagnostics+ AI is to use images of blood smear samples with other patient metadata to provide diagnosis either positive, negative or neutral with a confidence measure. Diagnostics+ would also like to have doctors in the loop to review the diagnosis, especially the harder cases, thereby allowing the AI system to learn from mistakes.
1.2 Types of Machine Learning Systems
There are three broad classes of machine learning systems that can be used to drive Diagnostics+ AI. They are supervised learning, unsupervised learning and reinforcement learning.
1.2.1 Representation of Data
Lets first see how to represent the data that a machine learning system can understand. For Diagnostics+, we know that theres historical data of blood smear samples in the form of images and patient metadata.
How do we best represent the image data? This is shown in Figure 1.3. Suppose the image of a blood smear sample is a colored image of size 256x256 pixels consisting of three primary channels red (R), green (G) and blue (B). This RGB image can be represented in mathematical form as three matrices of pixel values, one for each channel and each of size 256x256. The three two-dimensional matrices can be combined into a multi-dimensional matrix of size 256x256x3 to represent the RGB image. In general, the dimension of the matrix representing an image is of the form: {number of pixels vertically} x {number of pixels horizontally} x {number of channels} .

Figure 1.3: Representation of a Blood Smear Sample Image
Now, how do we best represent the patient metadata? Suppose that the metadata consists of information such as the patient identifier (id), age, sex and the final diagnosis. The metadata can be represented as a structured table shown in Figure 1.4, where there are N column and M rows. This tabular representation of the metadata can be easily converted into a matrix of dimension M x N. In Figure 1.4, you can see that the Patient Id, Sex and Diagnosis columns are categorical and have to be encoded as integers. For instance, the patient id AAABBCC is encoded as integer 0, sex M (for male) is encoded as integer 0 and diagnosis Positive is encoded as integer 1.
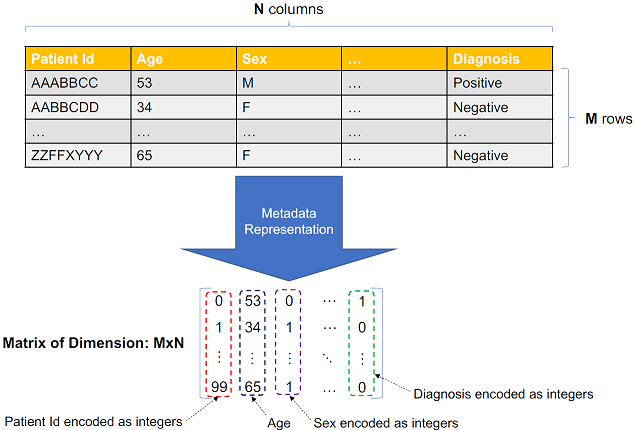
Figure 1.4: Representation of Tabular Patient Metadata
1.2.2 Supervised Learning
Supervised Learning is a type of machine learning system where the objective is to learn a mapping from an input to an output based on example input-output pairs. It requires labeled training data where inputs (also known as features ) have a corresponding label (also known as target ). Now how is this data represented? The input features are typically represented using a multi-dimensional array data structure or mathematically as a matrix X . The output or target is represented as a single-dimensional array data structure or mathematically as a vector y . The dimension of matrix X is typically m x n , where m represents the number of examples or labeled data and n represents the number of features. The dimension of vector y is typically m x 1 where m again represents the number of examples or labels. The objective is to learn a function f that maps from input features X to the target y . This is shown in Figure 1.5.
Next page
