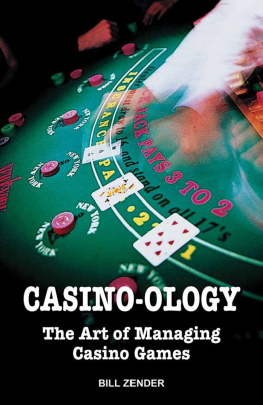
Casino-ology
The Art of Managing Casino Games
Bill Zender
HUNTINGTON PRESS
LAS VEGAS, NEVADA
Casino-ology
The Art of Managing Casino Games
Published by
Huntington Press
3665 Procyon Street
Las Vegas, NV 89103
Phone (702) 252-0655
e-mail:
Copyright 2008, Bill Zender
ISBN: 978-0-929712-56-7
Cover photo provided by MGM Mirage
Design & production: Laurie Cabot
All rights reserved. No part of this publication may be translated, reproduced, or transmitted in any form or by any means, electronic or mechanical, including photocopying and recording, or by any information storage and retrieval system, without the express written permission of the copyright owner.
Contents
Section I
Blackjack
Blackjack Performance Part I
Increase Profits at Blackjack:
The Importance of Time and Motion Issues
What one single element in the game of blackjack is most important to the casino executive regarding revenue? Game-protection procedures? Front-line-employee demeanor? The employees game skills and experience? The element of luck? All of these are important and have a great deal to do with blackjacks revenue flow; however, over the long run, no one element influences the profit, and profit potential, of any gambling device or game more than time and motionin other words, the number of decisions the game of blackjack achieves over a given period of time. Your defenses can be weak, your dealers sullen, and your staff inexperienced, but nothing amplifies your game strengths and weaknesses as much as the increase or decrease in the amount of hands your casino achieves during its period of operation. As this chapter points out, the increase (or decrease) of one round of blackjack over an hours time will make (or cost) your casino thousands of dollars annually. More important, the result produces a direct effect to your organizations bottom line.
Time and motion issues in blackjack are best described as the combination of game procedures, dealing mechanics, and theory application that maximizes (or minimizes) the number of results achieved per table during a specific period of time. By understanding and utilizing these performance issues, the casinos live-game manager can notably increase blackjack revenues without incurring additional operational costs.
For example, think of a hand of blackjack as a sales transaction. For each hand that is sold (i.e., dealt), the transaction will produce a theoretical amount of income for the casino. Since its safe to assume that an average house advantage in casino blackjack can be calculated in the neighborhood of 1.5%, it can also be assumed that for each $10 wager, the house will theoretically win 15. This means that every time a dealer achieves a pace of 400 hands an hour (average wager of $10), he or she in theory earns $60 in revenue for the house. This figure might not look like much, but multiply it by 24 hours, then by the average number of tables open, then again by 365 days, and youll see how much revenue these games will generate, even with a conservative average wager of $10.
The Advantage of Gaining Additional Rounds
The casino executive may have a difficult time getting the players to wager more and play worse, but he does have the ability to tweak the operation and squeeze out more outcomes. At this point the challenge to the knowledgeable gaming executive is, How can I increase our hourly round production from 55 to 60?
To better illustrate the effects realized from time and motion issues, the executive first needs to establish some type of operational benchmark that honestly depicts his existing blackjack game for measuring and comparing procedural and game-pace options. This can be accomplished by constructing a time-and-motion generator using a spreadsheet program like Excel. The elements that need to be considered are:
average number BJ tables open during a 24-hour period;
average number of players at an open BJ table;
average wager of all players;
estimated house advantage in BJ at the target casino.
The average number of tables open can be determined by breaking down shifts and days of the week. Ive found it easier and just as accurate to poll my shift managers and come up with an estimate based on their input. The average number of players and average wagers can also be deduced through the same process if more detailed information is not already kept by accounting, or an in-house financial analysis. Establishing your blackjack house advantage will be more difficult. The normal range to consider is between 1% to 1.8%, depending on the education level of your players, game rules, and number of decks utilized.
Once these metrics have been established, the executive can construct a workable model. For this example, Im using 12 BJ tables, 4.5 players, an $18 average wager, and a 1.5% house advantage as my metric inputs. This represents a medium-sized casino that is more likely representative of a Native American or Midwest riverboat casino.
Table 1
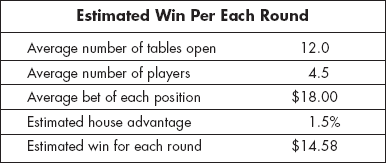
Table 1 indicates how much one round of blackjack is worth to the casino in theoretical win. This number is important, because it establishes a benchmark for comparing the effect of time and motion and the importance of achieving additional rounds dealt in the game of blackjack. For example, using the estimated gain from one round dealt, what would be the theoretical increase in revenue for gaining one additional hourly round, per day, month, and year?
Table 2
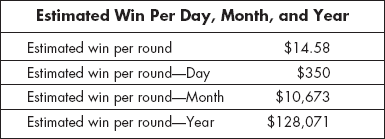
Isnt that interesting? What started out as a meager $15 gain for one additional round turns out to increase the casinos annual win figure by $128,000! The revenue figures in Table 2 can generally be obtained without increasing operational expenses by one cent, meaning any increase in revenue goes directly toward the operations bottom line profits.
Using the estimated annual figure, the executive can easily see the advantage from increasing the number of additional rounds dealt in the game of blackjack. A figure of $128,000 seems like a big number, but in most instances its only a starting point for revenue-gain potential. In most cases casinos do not put much emphasis on achieving more gaming results as compared to other concerns, and have created several areas in their game procedures, utilization of gaming equipment, and protection policies that bog down their hand and round production. From my experience as a gaming consultant, I can safely predict that most gaming operations can be improved to produce between three and seven additional rounds per table per hour. Based on this assumption, the average mid-sized casino has the potential to increase blackjack revenue from existing business in the neighborhood of $400,000 to $900,000 annually. Just think what the major casino operations could produce!
Understanding the Difference Between Rounds Dealt and Total Hands Dealt
Casino operators look at either rounds or hands dealt as an indicator of production. Unfortunately, most executives have a difficult time converting from one measurement to the other, similar to the confusion caused when converting the metric system to inches and feet. Since both methods of measurement are related based on certain assumptions, a simple calculation can be applied.
The measurement rounds takes into consideration one complete game or round dealt to all players and the dealer. In the example given in this section, a round would consist of 5.5 hands: 4.5 player hands and one dealer hand. However, the most widely used numbers are not derived from this small a sample, but from one hour of play on a given table game. The industry uses 60 dealing rounds per hour as the standard number that should be dealt. If we then insert the multiple of 5.5 representing the number of hands dealt per round, the calculations indicate 60 rounds is equal to 330 hands dealt. Please dont confuse this figure with the estimated-hands-dealt figure calculated during game-pace audits. This metric will be examined later in subsequent chapters.
Next page
