Alboukadel Kassambara [Kassambara - Practical Guide To Principal Component Methods in R (Multivariate Analysis Book 2)
Here you can read online Alboukadel Kassambara [Kassambara - Practical Guide To Principal Component Methods in R (Multivariate Analysis Book 2) full text of the book (entire story) in english for free. Download pdf and epub, get meaning, cover and reviews about this ebook. year: 2017, genre: Computer. Description of the work, (preface) as well as reviews are available. Best literature library LitArk.com created for fans of good reading and offers a wide selection of genres:
Romance novel
Science fiction
Adventure
Detective
Science
History
Home and family
Prose
Art
Politics
Computer
Non-fiction
Religion
Business
Children
Humor
Choose a favorite category and find really read worthwhile books. Enjoy immersion in the world of imagination, feel the emotions of the characters or learn something new for yourself, make an fascinating discovery.

- Book:Practical Guide To Principal Component Methods in R (Multivariate Analysis Book 2)
- Author:
- Genre:
- Year:2017
- Rating:4 / 5
- Favourites:Add to favourites
- Your mark:
Practical Guide To Principal Component Methods in R (Multivariate Analysis Book 2): summary, description and annotation
We offer to read an annotation, description, summary or preface (depends on what the author of the book "Practical Guide To Principal Component Methods in R (Multivariate Analysis Book 2)" wrote himself). If you haven't found the necessary information about the book — write in the comments, we will try to find it.
Alboukadel Kassambara [Kassambara: author's other books
Who wrote Practical Guide To Principal Component Methods in R (Multivariate Analysis Book 2)? Find out the surname, the name of the author of the book and a list of all author's works by series.
Practical Guide To Principal Component Methods in R (Multivariate Analysis Book 2) — read online for free the complete book (whole text) full work
Below is the text of the book, divided by pages. System saving the place of the last page read, allows you to conveniently read the book "Practical Guide To Principal Component Methods in R (Multivariate Analysis Book 2)" online for free, without having to search again every time where you left off. Put a bookmark, and you can go to the page where you finished reading at any time.
Font size:
Interval:
Bookmark:
Large data sets containing multiple samples and variables are collected everyday by researchers in various fields, such as in Bio-medical, marketing, and geo-spatial fields.
Discovering knowledge from these data requires specific techniques for analyzing data sets containing multiple variables. Multivariate analysis (MVA) refers to a set of techniques used for analyzing a data set containing more than one variable.
Among these techniques, there are:
- Cluster analysis for identifying groups of observations with similar profile according to a specific criteria.
- Principal component methods, which consist of summarizing and visualizing the most important information contained in a multivariate data set.
Previously, we published a book entitled "Practical Guide To Cluster Analysis in R" (https://goo.gl/DmJ5y5). The aim of the current book is to provide a solid practical guidance to principal component methods in R. Additionally, we developed an R package named factoextra to create, easily, a ggplot2-based elegant plots of the results of principal component method. Factoextra official online documentation: http://www.sthda.com/english/rpkgs/factoextra
One of the difficulties inherent in multivariate analysis is the problem of visualizing data that has many variables. In R, there are many functions and packages for displaying a graph of the relationship between two variables (http://www.sthda.com/english/wiki/data-visualization). There are also commands for displaying different three-dimensional views. But when there are more than three variables, it is more difficult to visualize their relationships.
Fortunately, in data sets with many variables, some variables are often correlated. This can be explained by the fact that, more than one variable might be measuring the same driving principle governing the behavior of the system. Correlation indicates that there is redundancy in the data. When this happens, you can simplify the problem by replacing a group of correlated variables with a single new variable.
Principal component analysis is a rigorous statistical method used for achieving this simplification. The method creates a new set of variables, called principal components. Each principal component is a linear combination of the original variables. All the principal components are orthogonal to each other, so there is no redundant information.
The type of principal component methods to use depends on variable types contained in the data set. This practical guide will describe the following methods:
Principal Component Analysis (PCA), which is one of the most popular multivariate analysis method. The goal of PCA is to summarize the information contained in a continuous (i.e, quantitative) multivariate data by reducing the dimensionality of the data without loosing important information.
Correspondence Analysis (CA), which is an extension of the principal component analysis for analyzing a large contingency table formed by two qualitative variables (or categorical data).
Multiple Correspondence Analysis (MCA), which is an adaptation of CA to a data table containing more than two categorical variables.
Factor Analysis of Mixed Data (FAMD), dedicated to analyze a data set containing both quantitative and qualitative variables.
Multiple Factor Analysis (MFA), dedicated to analyze data sets, in which variables are organized into groups (qualitative and/or quantitative variables).
Additionally, we'll discuss the HCPC (Hierarchical Clustering on Principal Component) method. It applies agglomerative hierarchical clustering on the results of principal component methods (PCA, CA, MCA, FAMD, MFA). It allows us, for example, to perform clustering analysis on any type of data (quantitative, qualitative or mixed data).
Figure 1 illustrates the type of analysis to be performed depending on the type of variables contained in the data set.
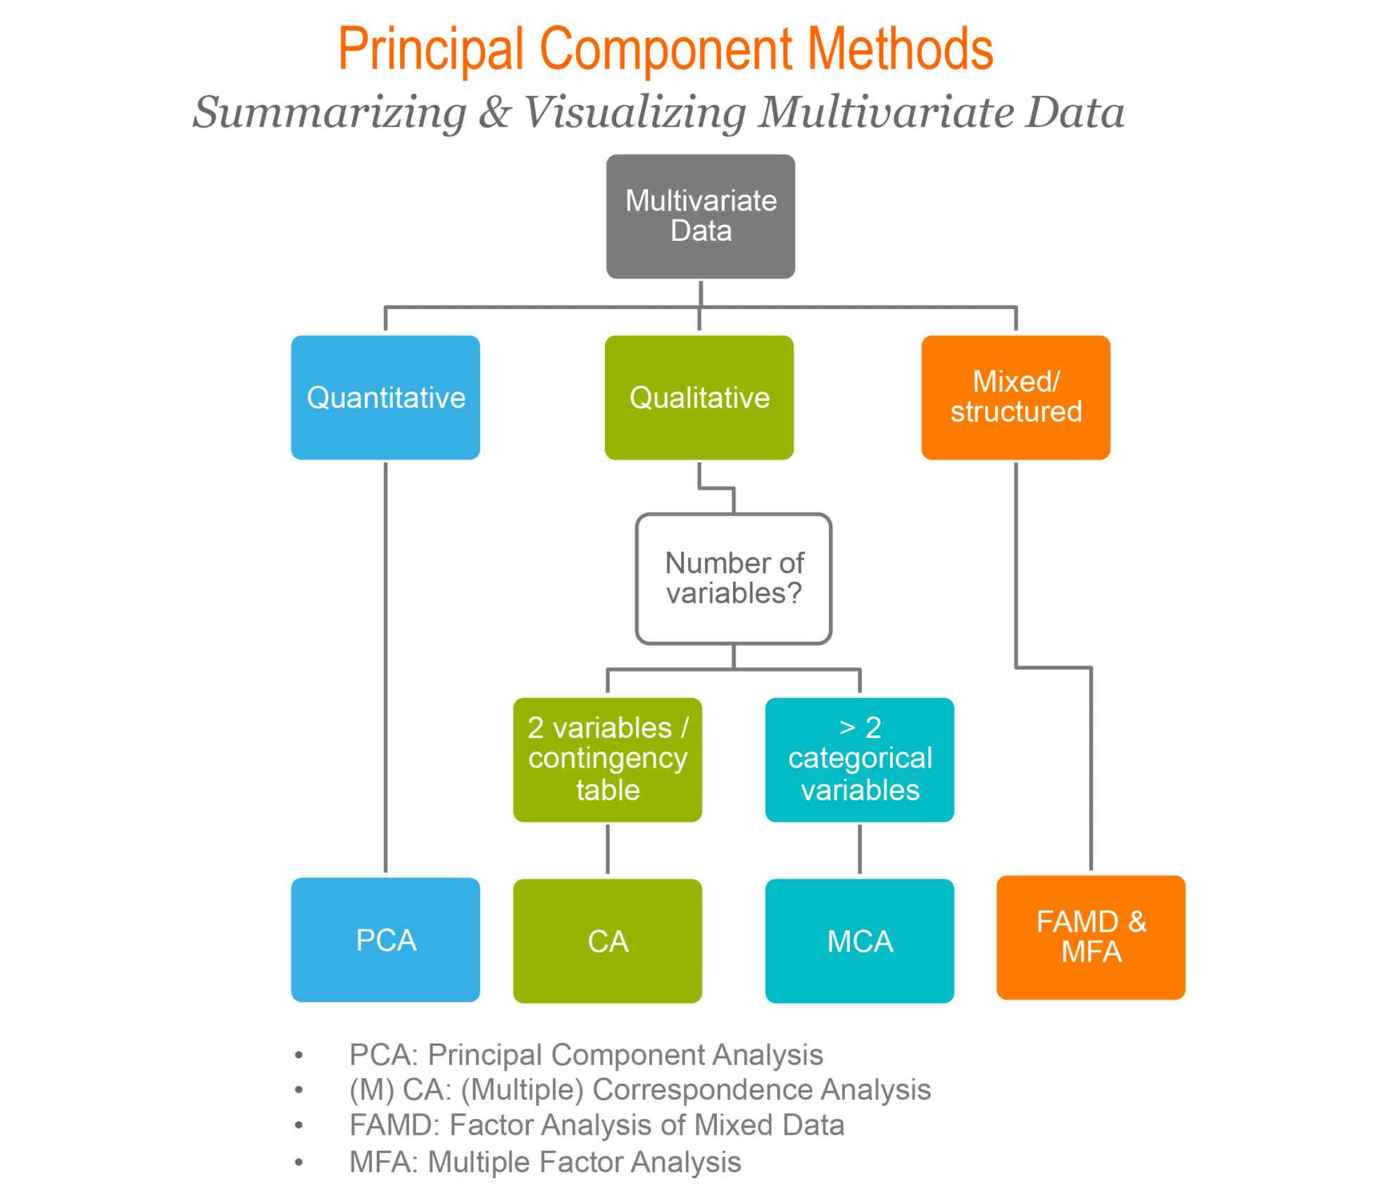 Principal component methods
 Although there are several good books on principal component methods and related topics, we felt that many of them are either too theoretical or too advanced.
Our goal was to write a practical guide to multivariate analysis, visualization and interpretation, focusing on principal component methods.
The book presents the basic principles of the different methods and provide many examples in R. This book offers solid guidance in data mining for students and researchers.
Key features
- Covers principal component methods and implementation in R
- Short, self-contained chapters with tested examples that allow for flexibility in designing a course and for easy reference
At the end of each chapter, we present R lab sections in which we systematically work through applications of the various methods discussed in that chapter. Additionally, we provide links to other resources and to our hand-curated list of videos on principal component methods for further learning.
This book is divided into 4 parts and 6 chapters. Part I provides a quick introduction to R (chapter ).
In Part II, we describe classical multivariate analysis methods:
- Principal Component Analysis - PCA (chapter )
- Correspondence Analysis - CA (chapter )
- Multiple Correspondence Analysis - MCA (chapter )
In part III, we continue by discussing advanced methods for analyzing a data set containing a mix of variables (qualitative & quantitative) organized or not into groups:
- Factor Analysis of Mixed Data - FAMD (chapter ) and,
- Multiple Factor Analysis - MFA (chapter ).
Finally, we show in Part IV, how to perform hierarchical clustering on principal components (HCPC) (chapter ), which is useful for performing clustering with a data set containing only qualitative variables or with a mixed data of qualitative and quantitative variables.
Some examples of plots generated in this book are shown hereafter. You'll learn how to create, customize and interpret these plots.
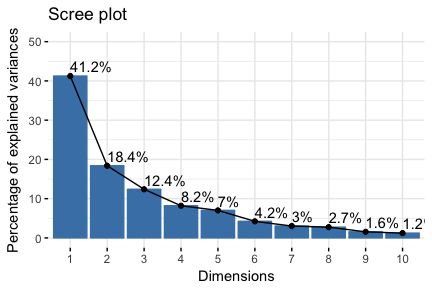
- Eigenvalues/variances of principal components. Proportion of information retained by each principal component.
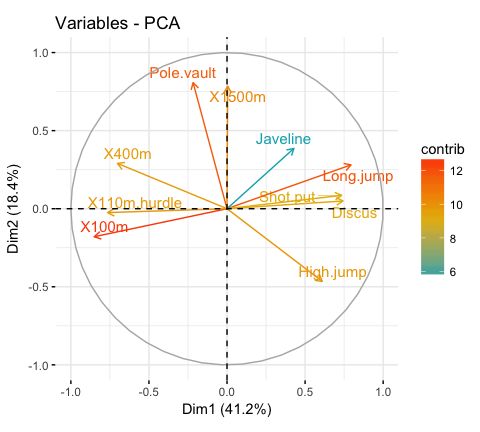
- PCA - Graph of variables:
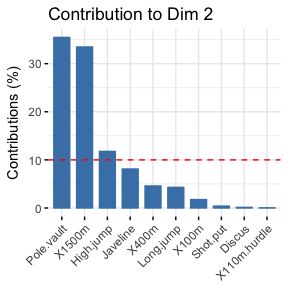
- Control variable colors using their contributions to the principal components.
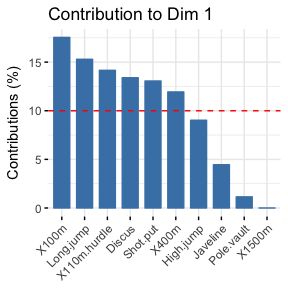
- Highlight the most contributing variables to each principal dimension:
- PCA - Graph of individuals:
Font size:
Interval:
Bookmark:
Similar books «Practical Guide To Principal Component Methods in R (Multivariate Analysis Book 2)»
Look at similar books to Practical Guide To Principal Component Methods in R (Multivariate Analysis Book 2). We have selected literature similar in name and meaning in the hope of providing readers with more options to find new, interesting, not yet read works.
Discussion, reviews of the book Practical Guide To Principal Component Methods in R (Multivariate Analysis Book 2) and just readers' own opinions. Leave your comments, write what you think about the work, its meaning or the main characters. Specify what exactly you liked and what you didn't like, and why you think so.