STATISTICS AND DATA ANALYSIS THROUGH R
CSAR PREZ LPEZ
INDEX
Chapter 1
EXPLORATORY DATA ANALYSIS THROUGH R
1.1 EXPLORATORY DATA ANALYSIS
Before applying any data analysis technique, it is necessary to perform a previous analysis of the information available. It is necessary to examine individual variables and the relationships between them, as well as to evaluate and solve problems in the design of the research and in the collection of data. The first task that is usually addressed is the exploratory and graphic analysis of the data . Most statistical software has tools that provide ready-made graphical techniques for data examination that are enhanced with more detailed statistical measurements for description. These techniques allow the examination of the distribution characteristics of the variables involved in the analysis, the bivariate (and multivariate) relationships between them and the analysis of differences between groups. It should be kept in mind that graphic representations never replace formal statistical diagnostic measures (data adjustment contrasts to a distribution, asymmetry contrasts, randomness contrasts, etc.), but provide an alternative way to develop a perspective on the character of the data and the interrelations that exist, even if they are multivariate.
The techniques of exploratory data analysis allow us to analyze the information exhaustively and to detect the possible anomalies that the observations present. J. W. Tuckey has been one of the pioneers in introducing this type of analysis. The most commonly used descriptive statistics have been the mean and standard deviation. However, the automatic use of these indices is not very advisable. The mean and standard deviation are convenient indexes only when the distribution of data is approximately normal or at least symmetric and unimodal. But the variables under study do not always meet these requirements. Therefore a thorough examination of the data structure is necessary.
It is recommended to start an exploratory data analysis with graphics that allow to visualize its structure. We are in front of the visual exploration tools. However, for formal exploration, the use of robust (or resistant) statistics is highly advisable when the data do not fit a normal distribution. These statistics are those that are little affected by outliers. They are usually based on the median and the quartiles and are easy to calculate. As a result of the exploratory analysis, it is sometimes necessary to carry out transformation of variables.
For quantitative data it is advisable to start with the stem and leaf chart or digital histogram. The next step is usually to examine the possible presence of normality, symmetry and outliers in the data set. For this purpose, box and mustache graphs are usually used. However, box plots should always be accompanied by digital histograms (or stem and leaf plots), since the former do not detect the presence of multimodal distributions. Scatter plots give us an idea of the relationships between variables and their adjustment.
1.1.1 Frequency Histogram
Anyway, it is always convenient to start the exploratory data analysis with the construction of the associated frequency histogram, in order to be able to intuit the probability distribution of the data, its normality, its symmetry and other interesting properties in the data analysis. As an example we can consider the variable X defined as the fuel consumption in liters at 1000 kilometers of the cars of a given brand. The values for X are as follows:
43,1 36,1 32,8 39,4 36,1 19,9 19,4 20,2 19,2 20,5 20,2 25,1 20,5 19,4 20,6
20,8 18,6 18,1 19,2 17,7 18,1 17,5 30 27,5 27,2 30,9 21,1 23,2 23,8 23,9
20,3 17 21,6 16,2 31,5 29,5 21,5 19,8 22,3 20,2 20,6 17 17,6 16,5 18,2
16,9 15,5 19,2 18,5 31,9 34,1 35,7 27,4 25,4 23 27,2 23,9 34,2 34,5 31,8
37,3 28,4 28,8 26,8 33,5 41,5 38,1 32,1 37,2 28 26,4 24,3 19,1 34,3 29,8
31,3 37 32,2 46,6 27,9 40,8 44,3 43,4 36,4 30,4 44,6 40,9 33,8 29,8 32,7
23,7 35 23,6 32,4 27,2 26,6 25,8 23,5 30 39,1 39 35,1 32,3 37 37,7
34,1 34,7 34,4 29,9 33 34,5 33,7 32,4 32,9 31,6 28,1 30,7 25,4 24,2 22,4
26,6 20,2 17,6 28 27 34 31 29 27 24 23 36 37 31 38
36 36 36 34 38 32 38 25 38 26 22 32 36 27 27
44 32 28 31
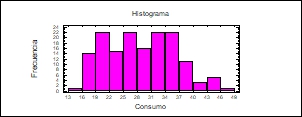
To explore this information we elaborated the frequency table associated to the data and studied the possible normality and symmetry of the fuel consumption distribution. As it is a quantitative variable with 154 values between 13 and 49, it will be necessary to group them in intervals or classes. To do this we take 12 intervals of equal width (12 is an integer that approximates well the square root of N = 154). The width of the intervals will be (49 - 13)/12 = 3. The frequency table in Figure 9-1 is obtained.
Interval | Limit below | Limit top | Brand Classroom | nor | fi = ni /N | Nor | Fi = ni /N |
| 13,0 | 16,0 | 14,5 | | 0,0065 | | 0,0065 |
| 16,0 | 19,0 | 17,5 | | 0,0909 | | 0,0974 |
| 19,0 | 22,0 | 20,5 | | 0,1429 | | 0,2403 |
| 22,0 | 25,0 | 23,5 | | 0,0974 | | 0,3377 |
| 25,0 | 28,0 | 26,5 | | 0,1429 | | 0,4805 |
| 28,0 | 31,0 | 29,5 | | 0,1039 | | 0,5844 |
| 31,0 | 34,0 | 32,5 | | 0,1429 | | 0,7273 |
| 34,0 | 37,0 | 35,5 | | 0,1429 | | 0,8701 |
| 37,0 | 40,0 | 38,5 | | 0,0714 | | 0,9416 |
| 40,0 | 43,0 | 41,5 | | 0,0195 | | 0,9610 |
| 43,0 | 46,0 | 44,5 | | 0,0325 | | 0,9935 |
| 46,0 | 49,0 | 47,5 | | 0,0065 | | 1,0000 |
Figure 9-1
We have observed the 154 values on the consumption of cars that initially did not provide much information. Obviously there is variability in car consumption; however, it is very difficult to detect what pattern this variability follows in order to better determine the structure of the data. Therefore, first of all it has been convenient to carry out an arrangement of the data according to its magnitude, that is to say, a table of frequencies, which will provide some light on the underlying frequency distribution.
The next task is the construction of the frequency histogram, a graph suitable for a quantitative variable with its values grouped in intervals. Its representation is presented in Figure 9-2.


