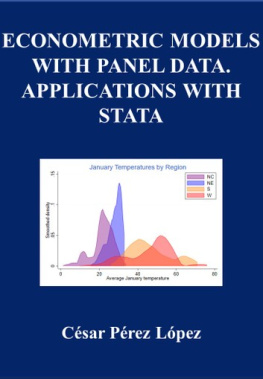
Cesar Perez Lopez - ECONOMETRIC MODELS WITH PANEL DATA. APPLICATIONS WITH STATA
Here you can read online Cesar Perez Lopez - ECONOMETRIC MODELS WITH PANEL DATA. APPLICATIONS WITH STATA full text of the book (entire story) in english for free. Download pdf and epub, get meaning, cover and reviews about this ebook. year: 2022, genre: Computer. Description of the work, (preface) as well as reviews are available. Best literature library LitArk.com created for fans of good reading and offers a wide selection of genres:
Romance novel
Science fiction
Adventure
Detective
Science
History
Home and family
Prose
Art
Politics
Computer
Non-fiction
Religion
Business
Children
Humor
Choose a favorite category and find really read worthwhile books. Enjoy immersion in the world of imagination, feel the emotions of the characters or learn something new for yourself, make an fascinating discovery.
- Book:ECONOMETRIC MODELS WITH PANEL DATA. APPLICATIONS WITH STATA
- Author:
- Genre:
- Year:2022
- Rating:3 / 5
- Favourites:Add to favourites
- Your mark:
- 60
- 1
- 2
- 3
- 4
- 5
ECONOMETRIC MODELS WITH PANEL DATA. APPLICATIONS WITH STATA: summary, description and annotation
We offer to read an annotation, description, summary or preface (depends on what the author of the book "ECONOMETRIC MODELS WITH PANEL DATA. APPLICATIONS WITH STATA" wrote himself). If you haven't found the necessary information about the book — write in the comments, we will try to find it.
Cesar Perez Lopez: author's other books
Who wrote ECONOMETRIC MODELS WITH PANEL DATA. APPLICATIONS WITH STATA? Find out the surname, the name of the author of the book and a list of all author's works by series.
ECONOMETRIC MODELS WITH PANEL DATA. APPLICATIONS WITH STATA — read online for free the complete book (whole text) full work
Below is the text of the book, divided by pages. System saving the place of the last page read, allows you to conveniently read the book "ECONOMETRIC MODELS WITH PANEL DATA. APPLICATIONS WITH STATA" online for free, without having to search again every time where you left off. Put a bookmark, and you can go to the page where you finished reading at any time.
Font size:
Interval:
Bookmark:
The list of individuals (or economic agents) constitutes a dimension and form another dimension the instants of time. Consider as an example the case of the panel of the income tax of the people physical (income tax panel) which develops the Institute of Fiscal Studies Spanish and which aims to have a database with the statements of the tax on the income of the same individuals every year. Different individuals are income tax payers and the time interval varies at present between 1999 and 2012. In them paragraphs following is delves a little more in the structures of data immersed in the two dimensions of a set of data of panel. On the one hand the data of cutting cross or section Cross and on the other hand them data of series temporary. Within the structures of data more important, typical in the work in economy applied, have the cross-sectional data.
A set of data of cross-section is a sample composed by individuals, families, companies, cities, States, countries u another type of units very varied collection in a time certain of the time. General can assume that the data of cross-section is have retrieved through a sampling random of the population underlying. For example, if we get information about wages, education, experience and other characteristics by choosing random 500 people of the employed population, we can say that we have a random samples of the population that has a job. In the case of income from income tax panel, we consider all the variables included in the model of tax and will be analysed for a given year. Considering the different years have all cross sections every year. The cross-sectional data are very often used in economics and other social sciences.
In economics, the analysis of cross-sectional data is closely related to various branches of the applied microeconomics, as tax analysis, the economics of labour, both State and local public finance industrial organization, the urban economy, demography and health economics. Data on individuals, families, companies and cities at a given moment of time are important to compare micro-economic hypotheses and assess economic and fiscal policies. A time series data set consists of observations on a variable or variables over time. Typical examples of time series data are gross domestic product, the money supply, consumer price indexes, annual rates of homicide or car sales figures. Time series data are more used in macroeconomic analysis, as opposed to the cross-sectional data, which are used mostly in microeconomic analysis. Time series tend to be more difficult to analyze than the cross-sectional data since we can almost never assume that economic observations are temporarily independent.
In the case of samples of income tax we can consider time series measuring the evolution of each variable of the tax over the period 1999-2012. A combination of cross sections or data pool is a fusion of several cross-sections of data collected at different points in time in the same population (but not for the same individuals). For example, suppose that two surveys of cross section on families in a country, one in 1985 and another in 1990 are. In 1985, a survey with a random sample is made to obtain variables such as the level of income, savings, the size of families, etc. In 1990, a new random sample of families is made and the same questions that in 1985 to do the survey are used. In order to increase the size of the sample, we can form a set of fused data of cross section by combining data from two years.
The fusion of different years often cross-sectional data is useful to analyze the effects of government policies. The idea is to collect data from the years before and after a key political change. Usually, fused cross-sectional data are analyzed very similar to conventional cross-sectional data, except that we often need to take into account differences in variables over time. In fact, in addition to increasing the size of the sample, the cross section data fusion aims often observe also how a key relationship has changed over time. However, by combining cross sections obtained by random sampling from the same population at different moments of time, we will have a sample of observations distributed independently but not identically. In the case of income tax could form a data pool joining all samples selected annually.
Obviously IRPF samples randomly selected each year do not correspond to the same individuals. A set of panel data, or longitudinal data, consists of a time series for each unit of a cross section (or set of cross-sectional data). A panel of data is a fusion of several cross-sections of data collected at different points in time (or in different geographical units or for different companies, etc.) in the same town for the same individuals. As an example, suppose that we have a record of data on wages, education, and the employment history of a set of individuals followed for a period of ten years. Also could collect information on them data financial or of investment of a same set of companies during a period of five years (therefore those individuals not have why be people). Panel data can also be collected about geographic units.
For example, we may collect data on flows of immigration, level of taxation, wages, cost of Government, etc., in the same set of countries of the European Union for the years 1990, 1995 and 2000. The key feature of the panel data, which differentiates them from the fused data of cross section, is the fact that is collected information of the same cross section (individuals, companies, countries, etc) units in the different moments of time. But we must not forget that the essential characteristic of a panel is its temporal dimension, given that is formed with observations on great variety of individuals taken at different moments of time, usually years. However, made differentiator of a panel is that usually the observations come from the same individuals at different moments in time . In addition, when the source of information that feeds the panel are administrative records there is virtually no response, which allows to form compact panels ideal for exempt of missing values and atypical data analysis without the application of methods of imputation of missing information be required. The stage of exploratory data analysis, prior to any application with panel data and decisive results, looks like this strongly favoured.
The double dimensionality of a panel leads us to consider the regression model with panel data as a set of models for each value of the temporary variable. Note that what we call here a temporary variable can be any other variable that classify individuals in various significant groups, for example geographical regions, companies, etc. However, for simplicity we will continue referring to this second dimension of the panel as a temporal dimension. Consider that we start from the regression model that has as the dependent variable the variable and independent variables x 1 , x 2 ,, x k , given by the equation: Given a set of N observations for each of the variables endogenous and exogenous, we can write the model as follows: i =1,, N Consider now the previous model for each temporary unit where t =1, 2,3,, T . This model, called panel data model, can be written as follows: or in closed notation: where i = 1,, N sample observations and t = 1,, T temporary moments. It is that u it are the terms of error at each time instant.
Font size:
Interval:
Bookmark:
Similar books «ECONOMETRIC MODELS WITH PANEL DATA. APPLICATIONS WITH STATA»
Look at similar books to ECONOMETRIC MODELS WITH PANEL DATA. APPLICATIONS WITH STATA. We have selected literature similar in name and meaning in the hope of providing readers with more options to find new, interesting, not yet read works.
Discussion, reviews of the book ECONOMETRIC MODELS WITH PANEL DATA. APPLICATIONS WITH STATA and just readers' own opinions. Leave your comments, write what you think about the work, its meaning or the main characters. Specify what exactly you liked and what you didn't like, and why you think so.

