• Complain

James D. Miller [James D. Miller] - Statistics for Data Science

Here you can read online James D. Miller [James D. Miller] - Statistics for Data Science full text of the book (entire story) in english for free. Download pdf and epub, get meaning, cover and reviews about this ebook. year: 2017, publisher: Packt Publishing, genre: Computer. Description of the work, (preface) as well as reviews are available. Best literature library LitArk.com created for fans of good reading and offers a wide selection of genres:

Romance novel Science fiction Adventure Detective Science History Home and family Prose Art Politics Computer Non-fiction Religion Business Children Humor

Choose a favorite category and find really read worthwhile books. Enjoy immersion in the world of imagination, feel the emotions of the characters or learn something new for yourself, make an fascinating discovery.

James D. Miller [James D. Miller] Statistics for Data Science

Statistics for Data Science: summary, description and annotation

We offer to read an annotation, description, summary or preface (depends on what the author of the book "Statistics for Data Science" wrote himself). If you haven't found the necessary information about the book — write in the comments, we will try to find it.

Get your statistics basics right before diving into the world of data science

About This Book

  • No need to take a degree in statistics, read this book and get a strong statistics base for data science and real-world programs;
  • Implement statistics in data science tasks such as data cleaning, mining, and analysis
  • Learn all about probability, statistics, numerical computations, and more with the help of R programs

Who This Book Is For

This book is intended for those developers who are willing to enter the field of data science and are looking for concise information of statistics with the help of insightful programs and simple explanation. Some basic hands on R will be useful.

What You Will Learn

  • Analyze the transition from a data developer to a data scientist mindset
  • Get acquainted with the R programs and the logic used for statistical computations
  • Understand mathematical concepts such as variance, standard deviation, probability, matrix calculations, and more
  • Learn to implement statistics in data science tasks such as data cleaning, mining, and analysis
  • Learn the statistical techniques required to perform tasks such as linear regression, regularization, model assessment, boosting, SVMs, and working with neural networks
  • Get comfortable with performing various statistical computations for data science programmatically

In Detail

Data science is an ever-evolving field, which is growing in popularity at an exponential rate. Data science includes techniques and theories extracted from the fields of statistics; computer science, and, most importantly, machine learning, databases, data visualization, and so on.

This book takes you through an entire journey of statistics, from knowing very little to becoming comfortable in using various statistical methods for data science tasks. It starts off with simple statistics and then move on to statistical methods that are used in data science algorithms. The R programs for statistical computation are clearly explained along with logic. You will come across various mathematical concepts, such as variance, standard deviation, probability, matrix calculations, and more. You will learn only what is required to implement statistics in data science tasks such as data cleaning, mining, and analysis. You will learn the statistical techniques required to perform tasks such as linear regression, regularization, model assessment, boosting, SVMs, and working with neural networks.

By the end of the book, you will be comfortable with performing various statistical computations for data science programmatically.

Style and approach

Step by step comprehensive guide with real world examples

Downloading the example code for this book. You can download the example code files for all Packt books you have purchased from your account at http://www.PacktPub.com. If you purchased this book elsewhere, you can visit http://www.PacktPub.com/support and register to have the code file.

James D. Miller [James D. Miller]: author's other books


Who wrote Statistics for Data Science? Find out the surname, the name of the author of the book and a list of all author's works by series.

Statistics for Data Science — read online for free the complete book (whole text) full work

Below is the text of the book, divided by pages. System saving the place of the last page read, allows you to conveniently read the book "Statistics for Data Science" online for free, without having to search again every time where you left off. Put a bookmark, and you can go to the page where you finished reading at any time.

Light

Font size:

Reset

Interval:

Bookmark:

Make
References

Yes, you will find that there is plenty of respectable, easy-to-understand, and valuable information and examples on artificial neural networks generously obtainable on the internet.

One such resource is offered by Gekko Quant (http://gekkoquant.com/author/gekkoquant/) and is worth taking some time to locate and read.

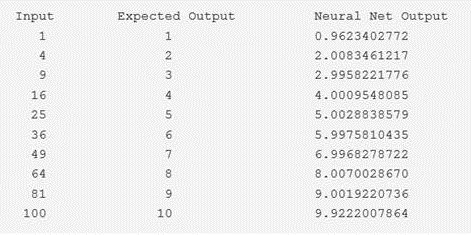
This information offers a very nice tutorial that produces an artificial neural network that takes a single input (a number that you want to calculate a square root for) and produces a single output (the square root of the number input).

The output of this artificial neural network example model is nicely displayed in an easy-to-understand format and I'll show it here as a great example of how the results of an ANN model should look:

Results of an ANN From the output information shown here you can see as the - photo 1
Results of an ANN

From the output information shown here, you can see (as the author declares) that the neural network does a reasonable job at finding the square root (of each input number).

Before a data scientist can begin the process of fitting an artificial neural network, some important time-saving groundwork needs to be accomplished, which we'll discuss in the next few sections.

To be sure, artificial neural networks are not easy to understand, train, and tune; some preparatory or preprocessing first is strongly recommended.

Quality questions

Suppose there are concerns about the quality of the data to be, or being, consumed by the organization. As we eluded to earlier in this chapter, there are different types of data quality concerns such as what we called mechanical issues as well as statistical issues (and there are others).

Current trending examples of the most common statistical quality concerns include duplicate entries and misspellings, misclassification and aggregation, and changing meanings.

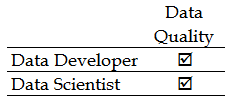
If management is questioning the validity of the total sales listed on a daily report or perhaps doesn't trust it because the majority of your customers are not legally able to drive in the United States, the number of the organizations repeat customers are declining, you have a quality issue:

Quality is a concern to both the data developer and the data scientist A data - photo 2

Quality is a concern to both the data developer and the data scientist. A data developer focuses more on timing and formatting (the mechanics of the data), while the data scientist is more interested in the data's statistical quality (with priority given to issues with the data that may potentially impact the reliability of a particular study).

A Developer's Approach to Data Cleaning

This chapter discusses how a developer might understand and approach the topic of data cleaning using several common statistical methods.

In this chapter, we've broken things into the following topics:

  • Understanding basic data cleaning
  • Using R to detect and diagnose common data issues, such as missing values, special values, outliers, inconsistencies, and localization
  • Using R to address advanced statistical situations, such as transformation, deductive correction, and deterministic imputation
Exploring relationships

If your statistical objective is to look for and learn about relationships in your data, you first examine your data for a form or, in other words, ask the question: does your data revolve around frequencies or measurements? From there, the number of predictor variables will dictate to you what regression (or other) approach you should use in your project.

AdaBoost

Back to our previous mention of a package named AdaBoost, which is short for adaptive boosting. AdaBoost is a boosting approach referred to as an ensemble learning algorithm. Ensemble learning is when multiple learners are used in conjunction with each other to build a stronger learning algorithm.

AdaBoost works by selecting a base algorithm and then iteratively improving it by accounting for the incorrectly classified examples in the training dataset.

A wonderful explanation of boosting and AdaBoost can be found online: Better living through AdaBoost http://bbacon.org/Better-Living-Through-AdaBoost.

The aforementioned article describes how AdaBoost works:

  • AdaBoost trains a model on a data subset
  • Weak learners (based upon performance) are weighted
  • The process is repeated

In narrative form, the AdaBoost boosting logic can be explained in the following way:

  • The process works by building a model on training data and then measuring the results' accuracy on that training data, then:
    • The individual results that were erroneous in the model are assigned a larger weight (or weighted more) than those that were correct, and then the model is retrained again using these new weights. This logic is then repeated multiple times, adjusting the weights of individual observations each time based on whether they were correctly classified or not in the last iteration!
The AdaBoost algorithm was originally offered by Freund and Schapire in the Journal of Computer and System Sciences in a 1997 paper titled A Decision-Theoretic Generalization of On-Line Learning and an Application to Boosting.
Who this book is for

This book is intended for those developers who are interested in entering the field of data science and are looking for concise information on the topic of statistics with the help of insightful programs and simple explanation.

www.PacktPub.com

For support files and downloads related to your book, please visit www.PacktPub.com .

Did you know that Packt offers eBook versions of every book published, with PDF and ePub files available? You can upgrade to the eBook version at www.PacktPub.com and as a print book customer, you are entitled to a discount on the eBook copy. Get in touch with us at service@packtpub.com for more details.

At www.PacktPub.com , you can also read a collection of free technical articles, sign up for a range of free newsletters and receive exclusive discounts and offers on Packt books and eBooks.

httpswwwpacktpubcommapt Get the most in-demand software skills with Mapt - photo 3

https://www.packtpub.com/mapt

Get the most in-demand software skills with Mapt. Mapt gives you full access to all Packt books and video courses, as well as industry-leading tools to help you plan your personal development and advance your career.

Boosting

In a manner of speaking, boosting is a process generally accepted in data science for improving the accuracy of a weak learning data science process.

Data science processes defined as weak learners are those that produce results that are only slightly better than if you would randomly guess the outcome. Weak learners are basically thresholds or a 1-level decision tree.

Specifically, boosting is aimed at reducing bias and variance in supervised learning.

What do we mean by bias and variance? Before going on further about boosting, let's take note of what we mean by bias and variance.

Data scientists describe bias as a level of favoritism that is present in the data collection process, resulting in uneven, disingenuous results and can occur in a variety of different ways. A sampling method is called

Next page
Light

Font size:

Reset

Interval:

Bookmark:

Make

Similar books «Statistics for Data Science»

Look at similar books to Statistics for Data Science. We have selected literature similar in name and meaning in the hope of providing readers with more options to find new, interesting, not yet read works.


Reviews about «Statistics for Data Science»

Discussion, reviews of the book Statistics for Data Science and just readers' own opinions. Leave your comments, write what you think about the work, its meaning or the main characters. Specify what exactly you liked and what you didn't like, and why you think so.