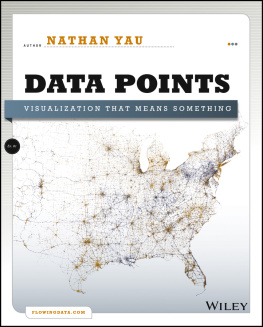
Statistics and Data Visualization Using R
For Michelle, Tim, and Jessica, who taught me to always leave a note.
Sara Miller McCune founded SAGE Publishing in 1965 to support the dissemination of usable knowledge and educate a global community. SAGE publishes more than 1000 journals and over 800 new books each year, spanning a wide range of subject areas. Our growing selection of library products includes archives, data, case studies and video. SAGE remains majority owned by our founder and after her lifetime will become owned by a charitable trust that secures the companys continued independence.
Los Angeles | London | New Delhi | Singapore | Washington DC | Melbourne
Statistics and Data Visualization Using R
The Art and Practice of Data Analysis
- David S. Brown
- University of Colorado Boulder
Copyright 2022 by SAGE Publications, Inc.
All rights reserved. Except as permitted by U.S. copyright law, no part of this work may be reproduced or distributed in any form or by any means, or stored in a database or retrieval system, without permission in writing from the publisher.
All third party trademarks referenced or depicted herein are included solely for the purpose of illustration and are the property of their respective owners. Reference to these trademarks in no way indicates any relationship with, or endorsement by, the trademark owner.
For Information:
SAGE Publications, Inc.
2455 Teller Road
Thousand Oaks, California 91320
E-mail: order@sagepub.com
SAGE Publications Ltd.
1 Olivers Yard
55 City Road
London, EC1Y 1SP
United Kingdom
SAGE Publications India Pvt. Ltd.
B 1/I 1 Mohan Cooperative Industrial Area
Mathura Road, New Delhi 110 044
India
SAGE Publications Asia-Pacific Pte. Ltd.
18 Cross Street #10-10/11/12
China Square Central
Singapore 048423
Library of Congress Control Number: 2021907690
ISBN 978-1-5443-3386-1
Printed in the United States of America
This book is printed on acid-free paper.
Acquisitions Editor: Leah Fargotstein
Product Associate: Ivey Mellem
Production Editor: Rebecca Lee
Copy Editor: Christina West
Typesetter: Hurix Digital
Indexer: Integra
Cover Designer: Gail Buschman
Marketing Manager: Victoria Velasquez
Brief Contents
Preface
Infiltrate the dealers find the suppliers.
Ice Cube in 21 Jump Street (Sony Pictures, 2012)
This book was written to encourage, inspire, and excite students about data analysis in the social sciences. Its fundamental premise is that students learn data analysis by doing data analysis. Toward that end, it starts with simple graphical techniques used to explore data and to ask interesting questions of the data. Emphasis is placed on methods used to identify problems that lurk far beneath the clean veneer of a regression table. In the end, readers will be conversant in basic data analytic techniques and will have developed an approach to data analysis, understanding the conceptual, analytical, and even philosophical choices made. Crucial in my view, an important goal is to excite the reader about the enterprise. The material is designed to engage as we confront real-world issues and problems with real data. Readers are encouraged to play with the data the book is based on by downloading the data file on the SAGE companion website. After the data are downloaded, be sure to execute the installD()and libraries() commands before starting. The first command installs all the necessary packages, while the second loads them. The installD() command only needs to be executed once; the libraries() command needs to be executed whenever R is restarted.
Who Is This Book For?
This book is for several audiences. Primarily, the book is for the beginner. It assumes no prior knowledge of statistics or calculus, yet having a solid background in either does not make the exercise unprofitable. The book stems from a large Introduction to Quantitative Methods course I taught at the University of Colorado. It is a required class for political science majors who need to read, understand, and critically examine the growing amount of quantitative evidence. Our sincere hope in the class is to arm students with a set of skills to help solve problems.
Like a biologist uses an electron microscope, the data analyst uses R, an object-oriented statistical language that has established a strong foothold in private industry, primarily among data scientists. While learning statistics with pencil and paper is admirable and advantageous pedagogically, students must be armed with a state-of-the-art tool in this era of Big Data. The book is designed for the reader to download the accompanying data and follow along. The code provides, in my experience, an excellent set of commands that many beginning, intermediate, and advanced analysts can use.
For those with more experience, the book presents an approach that emphasizes how simple analyses can generate better questions through the back-and-forth between description, theory, and evidence. The book encourages formulating hypotheses, looking at the evidence, then generating additional hypotheses from that evidence. A deep understanding of the material is demonstrated by the reader, in my opinion, when a hypothesis is constructed to ask the next question. More than learning code, more than understanding probability theory, this book seeks to foster a never-ending cycle of discovery characterized by describing what we see, formulating a hypothesis, testing it empirically, then generating the next question or hypothesis. In that sense, even those with more technical facility can benefit.
Organization
Most statistics texts start with the basics of probability theory, followed by sampling and hypothesis testing, and end with correlation and regression analysis. While conceptually coherent, the student first must begin the semester overcoming a fear of probability theory, must decipher a standard normal or t-table, then in the last two weeks (usually after Thanksgiving or spring break) master bivariate or multiple regression analysis. There are two schools of thought here and the book accommodates both. Some insist that the probabilistic underpinnings of regression theory must come before the first line is fit to the data. Others like to start fitting lines and constructing models on day 1. They argue that only after the student has confronted the challenge of building models, generating estimates, and evaluating the models fit is there a strong motivation to understand the probabilistic machinery used to generate t-ratios, R2 statistics, and confidence intervals. The book is designed so that after describing data and making comparisons, you can skip and proceed to regression analysis. The chapters on diagnostics provide an intuitive sense of the Gauss-Markov assumptions that underpin linear regression.
There is also a chapter dedicated to the presentation of data (). Too often, no time is spent even with the most elemental principles of how to present the findings we generate to an audience. I mix the pioneering work by Edward Tufte with some more recent contributions that emphasize the storytelling aspects of the enterprise.





![Thomas Mailund [Thomas Mailund] - Beginning Data Science in R: Data Analysis, Visualization, and Modelling for the Data Scientist](/uploads/posts/book/119629/thumbs/thomas-mailund-thomas-mailund-beginning-data.jpg)
