
Contents
Preface
a
Introduction
a
a
a
a
a
a
s
s
s

s
Introduction
u
s
s
a
s
s
Sensors
s
s
s
t
Conclusion
s

e
Introduction
e
n
Netflix
Ebay
VMWare
y
TicketMaster
LinkedIn
Paypal
CERN
Conclusion
s

p Introduction
k
m
y
S
S
s
YARN
Conclusion
s
e Introduction
g
s
g
s
n
s
s
t
s
g
Conclusion
s
s Introduction
m
s
HBase
w
a
Cassandra
w
a
e
s
e
Conclusion
s
k Introduction
e
)
)
m
g MLlib
X
SparkR
SparkSQL
g
p Conclusion
s
a
Wholeness
s
m
a
s
e
Producers
Consumers
Broker
Topic
s
Distribution
Guarantees
s
r
a Conclusion
s
References
r
Introduction
e
e
e
s
s
d
Conclusion
s
y Introduction
r
Requirements
e
k
t
k
HDFS
MongoDB
e
a
:
s
s
s
r
a
n
g
s
s
a
m
s
Conclusion
s
)
.
e
n
a
a
k
k
n
a
Chapter 1 Wholeness of Big Data
Introduction
Big Data is an all-inclusive term that refers to extremely large, very fast, diverse, and complex data that cannot be managed with traditional data management tools. Ideally, Big Data would harness all kinds of data, and deliver the right information, to the right person, in the right quantity, at the right time, to help make the right decision. Big Data can be managed by developing infinitely scalable, totally flexible, and evolutionary data architectures, coupled with the use of extremely cost-effective computing components. The infinite potential knowledge embedded within this cosmic computer would help connect everything to the Unified Field of all the laws of nature.
This book will provide a complete overview of Big Data for the executive and the data specialist. This chapter will cover the key challenges and benefits of Big Data, and the essential tools and technologies now available for organizing and manipulating Big Data.
Understanding Big Data
Big Data can be examined on two levels. On a fundamental level, it is data that can be analyzed and utilized for the benefit of the business. On another level, it is a special kind of data that poses unique challenges. This is the level that this book will focus on.
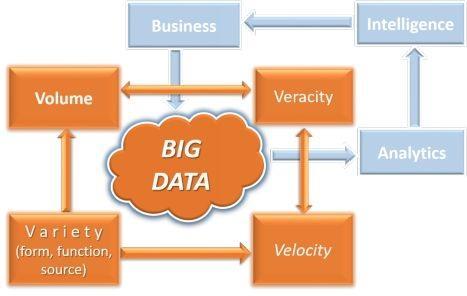
Figure 1- 1: Big Data Context
At the level of business, data generated by business operations, can be analyzed to generate insights that can help the business make better decisions. This makes the business grow bigger, and generate even more data, and the cycle continues. This is represented by the blue cycle on the top-right of Figure 1.1. This aspect is discussed in Chapter 10, a primer on Data Analytics.
On another level, Big Data is different from traditional data in every way: space, time, and function. The quantity of Big Data is 1,000 times more than that of traditional data. The speed of data generation and transmission is 1,000 times faster. The forms and functions of Big Data are much more diverse: from numbers to text, pictures, audio, videos, activity logs, machine data, and more. There are also many more sources of data, from individuals to organizations to governments, using a range of devices from mobile phones to computers to industrial machines. Not all data will be of equal quality and value. This is represented by the red cycle on the bottom left of Figure 1.1. This aspect of Big Data, and its new technologies, is the main focus of this book.
Big Data is mostly unstructured data. Every type of data is structured differently, and will have to be dealt with differently. There are huge opportunities for technology providers to innovate and manage the entire life cycle of Big Data to generate, gather, store, organize, analyze, and visualize this data.
CASELET: IBM Watson: A Big Data system
IBM created the Watson system as a way of pushing the boundaries of Artificial Intelligence and natural language understanding technologies. Watson beat the world champion human players of Jeopardy (quiz style TV show) in Feb 2011. Watson reads up on data about everything on the web including the entire Wikipedia. It digests and absorbs the data based on simple generic rules such as: books have authors; stories have heroes; and drugs treat ailments. A jeopardy clue, received in the form of a cryptic phrase, is broken down into many possible potential sub-clues of the correct answer. Each sub-clue is examined to see the likeliness of its answer being the correct answer for the main problem. Watson calculates the confidence level of each possible answer. If the confidence level reaches more than a threshold level, it decides to offer the answer to the clue. It manages to do all this in a mere 3 seconds.
Watson is now being applied to diagnosing diseases, especially cancer. Watson can read all the new research published in the medical journals to update its knowledge base. It is being used to diagnose the probability of various diseases, by applying factors such as patients current symptoms, health history, genetic history, medication records, and other factors to recommend a particular diagnosis. (Source: Smartest machines on Earth: youtube.com/watch?v=TCOhyaw5bwg)
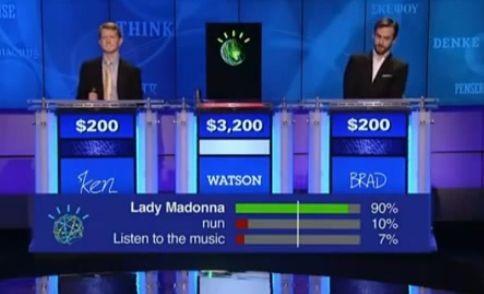
Figure 1.2: IBM Watson playing Jeopardy
Q1: What kinds of Big Data knowledge, technologies and skills are required to build a system like Watson? What kind of resources are needed?
Q2: Will doctors be able to compete with Watson in diagnosing diseases
and prescribing medications? Who else could benefit from a system like Watson?
Capturing Big Data
If data were simply growing too large, OR only moving too fast, OR only becoming too diverse, it would be relatively easy. However, when the four Vs (Volume, Velocity, Variety, and Veracity) arrive together in an interactive manner, it creates a perfect storm. While the Volume and Velocity of data drive the major technological concerns and the
costs of managing Big Data, these two Vs are themselves being driven by the 3 rd V, the Variety of forms and functions and sources of data.
Volume of Data
The quantity of data has been relentlessly doubling every 12-18 months. Traditional data is measured in Gigabytes (GB) and Terabytes (TB), but Big Data is measured in Petabytes (PB) and Exabytes (1 Exabyte = 1 Million TB).
Next page


