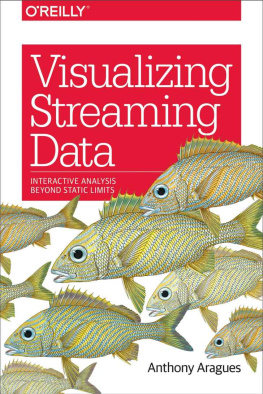
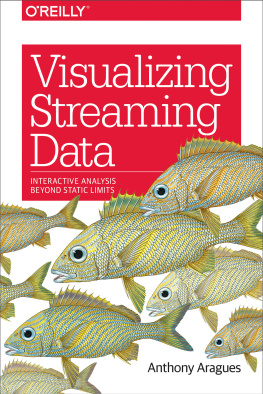
Anthony Aragues - Visualizing Streaming Data: Interactive Analysis Beyond Static Limits
Here you can read online Anthony Aragues - Visualizing Streaming Data: Interactive Analysis Beyond Static Limits full text of the book (entire story) in english for free. Download pdf and epub, get meaning, cover and reviews about this ebook. year: 2018, publisher: O’Reilly Media, Inc., genre: Computer. Description of the work, (preface) as well as reviews are available. Best literature library LitArk.com created for fans of good reading and offers a wide selection of genres:
Romance novel
Science fiction
Adventure
Detective
Science
History
Home and family
Prose
Art
Politics
Computer
Non-fiction
Religion
Business
Children
Humor
Choose a favorite category and find really read worthwhile books. Enjoy immersion in the world of imagination, feel the emotions of the characters or learn something new for yourself, make an fascinating discovery.
- Book:Visualizing Streaming Data: Interactive Analysis Beyond Static Limits
- Author:
- Publisher:O’Reilly Media, Inc.
- Genre:
- Year:2018
- Rating:3 / 5
- Favourites:Add to favourites
- Your mark:
- 60
- 1
- 2
- 3
- 4
- 5
Visualizing Streaming Data: Interactive Analysis Beyond Static Limits: summary, description and annotation
We offer to read an annotation, description, summary or preface (depends on what the author of the book "Visualizing Streaming Data: Interactive Analysis Beyond Static Limits" wrote himself). If you haven't found the necessary information about the book — write in the comments, we will try to find it.
Anthony Aragues: author's other books
Who wrote Visualizing Streaming Data: Interactive Analysis Beyond Static Limits? Find out the surname, the name of the author of the book and a list of all author's works by series.
Visualizing Streaming Data: Interactive Analysis Beyond Static Limits — read online for free the complete book (whole text) full work
Below is the text of the book, divided by pages. System saving the place of the last page read, allows you to conveniently read the book "Visualizing Streaming Data: Interactive Analysis Beyond Static Limits" online for free, without having to search again every time where you left off. Put a bookmark, and you can go to the page where you finished reading at any time.
Font size:
Interval:
Bookmark:
Interactive Analysis Beyond Static Limits
Anthony Aragues
by Anthony Aragues
Copyright 2018 Anthony Aragues. All rights reserved.
Printed in Canada.
Published by OReilly Media, Inc. , 1005 Gravenstein Highway North, Sebastopol, CA 95472.
OReilly books may be purchased for educational, business, or sales promotional use. Online editions are also available for most titles (.
- Acquisitions Editor: Rachel Roumeliotis
- Development Editor: Angela Rufino
- Production Editor: Justin Billing
- Copyeditor: Rachel Head
- Proofreader: Sharon Wilkey
- Indexer: WordCo, Inc.
- Interior Designer: David Futato
- Cover Designer: Karen Montgomery
- Illustrator: Rebecca Demarest
- June 2018: First Edition
- 2018-05-30: First Release
See http://oreilly.com/catalog/errata.csp?isbn=9781492031857 for release details.
The OReilly logo is a registered trademark of OReilly Media, Inc. Visualizing Streaming Data, the cover image, and related trade dress are trademarks of OReilly Media, Inc.
While the publisher and the author have used good faith efforts to ensure that the information and instructions contained in this work are accurate, the publisher and the author disclaim all responsibility for errors or omissions, including without limitation responsibility for damages resulting from the use of or reliance on this work. Use of the information and instructions contained in this work is at your own risk. If any code samples or other technology this work contains or describes is subject to open source licenses or the intellectual property rights of others, it is your responsibility to ensure that your use thereof complies with such licenses and/or rights.
978-1-492-03185-7
[TI]
Several things converged to lead me to write this book. Im a huge science-fiction nerd. I fell in love with fantasy user interfacesthe interfaces in movies and TV shows, often used as plot devices. When they are well done, they fit the needs of the actors perfectlyat a glance immediately conveying a status, a transition, and then a new status. I looked for years for kits to help me make real interfaces that were more like these. As I got better at programming, I realized that it always makes sense to specifically design an interface for an aesthetic and a plot instead of relying on a general working toolkit that is themed. I resigned myself to the fact that the kit I was looking for wouldnt be forthcoming.
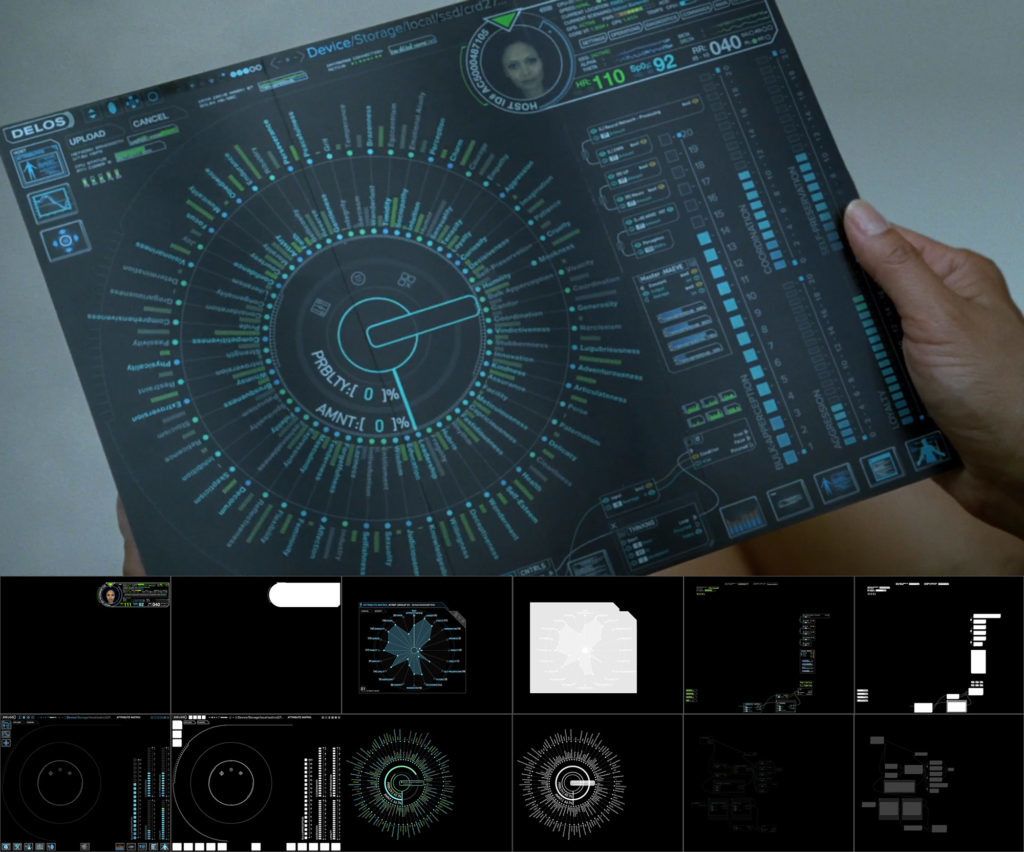
As I broke down fantasy user interfaces into common components and logic, I realized they werent that complex, and lots of the components would be universally useful. These fantasy UIs did break a lot of rules, though. In order to show transitions in a plot, they show things changing. Data streams in and impacts the status. Entire sections move or transform in ways we typically would not do in a dashboard. The conventional wisdom on dashboards by people like Stephen Few is that they should convey status at a glance. That can be difficult to do when everything is moving and transforming simultaneously. There is real value outside the defined conventional wisdom on what to do for dashboards; it just fits a different need. If we quit comparing our interfaces to a dashboard that already has a set purpose, we can set new rules.
A recent example can be seen in the fantasy world of Westworld on HBO (see ). They have mock user interfaces that represent the future of technology and show current information compared to thresholds and norms. It looks amazing and is inspiring as a goal to reach in working systems.
I have been working in technology for most of my life. I have seen a lot of problems solved by looking at raw data streaming by, but in the last 20+ years I havent really seen this evolving. Logs, events, or messages are streamed in a console, and at most they are filtered and highlighted inline. You have to be looking at the screen at the moment something displays, and if you miss it, maybe it will show up in your daily reports tomorrow. This was OK for systems that might have a line in the console per minute, but it doesnt work for todays systems, where thousands per second are typical. Even at this volume, Ive seen problems solved by glancing at streaming logs that would not be caught in daily reports, where the information is too abstracted and aggregated. After observing this pattern over the years, I want to make a viable solution that falls between the logs on the console and the at-a-glance dashboard.
Technology doesnt advance itself. What I really want is to be more interactive with systems. I want things like augmented reality to be practical, unobtrusive, and helpful. When I think of what that requires, I keep seeing things that are in the way, stepping stones that must be crossed before getting there. One of the major stepping stones technology seems to be skipping over is providing an understanding of what a system decides. When artificial intelligence is deciding something for me, I want to know why. The more times I look into why something was decided and can correct those assumptions, the more trust I have in a system. Netflix does a decent job of recommending shows, and it tells you why it recommends something and what the confidence level is, but you cant correct the algorithm. Its not interactive. It observes, does magic, and you see the results.
In order for us to progress beyond a certain point in technology, we are going to have to take a couple of steps back and correct this. We have to redesign some things to allow humans to be more collaborative partners in these decisions. This is difficult today because most systems decide things for you centrally. An algorithm is applied universally. If genre and language are the key factors in recommending similar movies, thats how its done for everyone. Theres nowhere that I know of where I can increase the weight of awesome fantasy user interfaces and novel spaceship design to find movies that might interest me. This level of customization requires the intelligence to be more individual, or multitiered.
The significance of being able to understand and alter machine decisions goes way beyond entertainment. AI algorithms thoroughly influence your perspective through the information you seethey determine the results of your Internet searches. When you access information online, security devices decide what information appears safe (with a very loose yet inflexible definition of safe). On the physical side of security, we have algorithms deciding who is on a watchlist and who might commit crimes. Similarly complex algorithms have not been permitted in the assessment of credit scores because they must be easily defensible in court. Thats the level of accountability and understanding all automated decisions need to reach.
Finally, I started developing my own tools and components to fit this niche area of data presentation I kept running across. After years of thought on the subject, I realized that it was something rarely explored. Most of the organizations I run into are overwhelmed by what they find in their daily reports. They arent thinking about what they might improve by reacting faster to certain events and getting ahead of things. It takes some new perspectives, case studies, and more to take something like this from a novel idea to a practical solution. I hope that this book helps contribute toward that progression.
Font size:
Interval:
Bookmark:
Similar books «Visualizing Streaming Data: Interactive Analysis Beyond Static Limits»
Look at similar books to Visualizing Streaming Data: Interactive Analysis Beyond Static Limits. We have selected literature similar in name and meaning in the hope of providing readers with more options to find new, interesting, not yet read works.
Discussion, reviews of the book Visualizing Streaming Data: Interactive Analysis Beyond Static Limits and just readers' own opinions. Leave your comments, write what you think about the work, its meaning or the main characters. Specify what exactly you liked and what you didn't like, and why you think so.

