• Complain

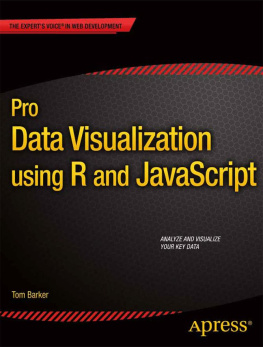
Tom Barker - Pro Data Visualization using R and JavaScript

Here you can read online Tom Barker - Pro Data Visualization using R and JavaScript full text of the book (entire story) in english for free. Download pdf and epub, get meaning, cover and reviews about this ebook. year: 2013, publisher: Apress, genre: Computer. Description of the work, (preface) as well as reviews are available. Best literature library LitArk.com created for fans of good reading and offers a wide selection of genres:

Romance novel Science fiction Adventure Detective Science History Home and family Prose Art Politics Computer Non-fiction Religion Business Children Humor

Choose a favorite category and find really read worthwhile books. Enjoy immersion in the world of imagination, feel the emotions of the characters or learn something new for yourself, make an fascinating discovery.

Tom Barker Pro Data Visualization using R and JavaScript
  • Book:
    Pro Data Visualization using R and JavaScript
  • Author:
  • Publisher:
    Apress
  • Genre:
  • Year:
    2013
  • Rating:
    4 / 5
  • Favourites:
    Add to favourites
  • Your mark:
    • 80
    • 1
    • 2
    • 3
    • 4
    • 5

Pro Data Visualization using R and JavaScript: summary, description and annotation

We offer to read an annotation, description, summary or preface (depends on what the author of the book "Pro Data Visualization using R and JavaScript" wrote himself). If you haven't found the necessary information about the book — write in the comments, we will try to find it.

Pro Data Visualization using R and JavaScript makes the R language approachable, and promotes the idea of data gathering and analysis. Youll see how to use R to interrogate and analyze your data, and then use the D3 JavaScript library to format and display that data in an elegant, informative, and interactive way. You will learn how to gather data effectively, and also how to understand the philosophy and implementation of each type of chart, so as to be able to represent the results visually.
With the popularity of the R language, the art and practice of creating data visualizations is no longer the preserve of mathematicians, statisticians, or cartographers. As technology leaders, we can gather metrics around what we do and use data visualizations to communicate that information. Pro Data Visualization using R and JavaScript combines the power of the R language with the simplicity and familiarity of JavaScript to display clear and informative data visualizations.
Gathering and analyzing empirical data is the key to truly understanding anything. We can track operational metrics to quantify the health of our products in production. We can track quality metrics of our projects, and even use our data to identify bad code. Visualizing this data allows anyone to read our analysis and easily get a deep understanding of the story the data tells.

What youll learn
  • A rich understanding of how to gather, and analyze empirical data
  • How to tell a story with data using data visualizations
  • What types of data visualizations are best to use for the story that you want to tell with your data
  • A comprehensive introduction to the R language, covering all the essentials
  • Exploration of how to construct interactive data visualizations using JavaScript and JavaScript libraries
Who this book is for

Developers at all levels interested in data visualization, beginning to intermediate engineering managers, statisticians, mathematicians, economists and any others interested in data visualization.

Table of Contents
  1. Techniques for Data Visualization
  2. The R Language
  3. A Deeper Dive into R
  4. Data Visualization with D3
  5. Visualizing Spatial Information from Access Logs (Data Maps)
  6. Visualizing Defects over Time (Time Series)
  7. Bar Charts
  8. Correlation Analysis with Team Dynamics (Scatterplot and Bubble Chart)
  9. Balancing Delivery with Quality (Parallel Coordinates Chart)

Tom Barker: author's other books


Who wrote Pro Data Visualization using R and JavaScript? Find out the surname, the name of the author of the book and a list of all author's works by series.

Pro Data Visualization using R and JavaScript — read online for free the complete book (whole text) full work

Below is the text of the book, divided by pages. System saving the place of the last page read, allows you to conveniently read the book "Pro Data Visualization using R and JavaScript" online for free, without having to search again every time where you left off. Put a bookmark, and you can go to the page where you finished reading at any time.

Light

Font size:

Reset

Interval:

Bookmark:

Make

Pro Data Visualization using R and JavaScript - image 1

Pro Data Visualization using R and JavaScript

Pro Data Visualization using R and JavaScript - image 2

Tom Barker

Pro Data Visualization using R and JavaScript - image 3

Pro Data Visualization using R and JavaScript

Copyright 2013 by Tom Barker

This work is subject to copyright. All rights are reserved by the Publisher, whether the whole or part of the material is concerned, specifically the rights of translation, reprinting, reuse of illustrations, recitation, broadcasting, reproduction on microfilms or in any other physical way, and transmission or information storage and retrieval, electronic adaptation, computer software, or by similar or dissimilar methodology now known or hereafter developed. Exempted from this legal reservation are brief excerpts in connection with reviews or scholarly analysis or material supplied specifically for the purpose of being entered and executed on a computer system, for exclusive use by the purchaser of the work. Duplication of this publication or parts thereof is permitted only under the provisions of the Copyright Law of the Publisher's location, in its current version, and permission for use must always be obtained from Springer. Permissions for use may be obtained through RightsLink at the Copyright Clearance Center. Violations are liable to prosecution under the respective Copyright Law.

ISBN-13 (pbk): 978-1-4302-5806-3

ISBN-13 (electronic): 978-1-4302-5807-0

Trademarked names, logos, and images may appear in this book. Rather than use a trademark symbol with every occurrence of a trademarked name, logo, or image we use the names, logos, and images only in an editorial fashion and to the benefit of the trademark owner, with no intention of infringement of the trademark.

The use in this publication of trade names, trademarks, service marks, and similar terms, even if they are not identified as such, is not to be taken as an expression of opinion as to whether or not they are subject to proprietary rights.

While the advice and information in this book are believed to be true and accurate at the date of publication, neither the authors nor the editors nor the publisher can accept any legal responsibility for any errors or omissions that may be made. The publisher makes no warranty, express or implied, with respect to the material contained herein.

President and Publisher: Paul Manning

Lead Editor: Ben Renow-Clarke

Technical Reviewer: Matthew Canning

Editorial Board: Steve Anglin, Mark Beckner, Ewan Buckingham, Gary Cornell, Louise Corrigan, Morgan Ertel, Jonathan Gennick, Jonathan Hassell, Robert Hutchinson, Michelle Lowman, James Markham, Matthew Moodie, Jeff Olson, Jeffrey Pepper, Douglas Pundick, Ben Renow-Clarke, Dominic Shakeshaft, Gwenan Spearing, Matt Wade, Tom Welsh

Coordinating Editor: Christine Ricketts

Copy Editor: Nancy Sixsmith

Compositor: SPi Global

Indexer: SPi Global

Artist: SPi Global

Cover Designer: Anna Ishchenko

Distributed to the book trade worldwide by Springer Science+Business Media New York, 233 Spring Street, 6th Floor, New York, NY 10013. Phone 1-800-SPRINGER, fax (201) 348-4505, e-mail . Apress Media, LLC is a California LLC and the sole member (owner) is Springer Science + Business Media Finance Inc (SSBM Finance Inc). SSBM Finance Inc is a Delaware corporation.

For information on translations, please e-mail .

Apress and friends of ED books may be purchased in bulk for academic, corporate, or promotional use. eBook versions and licenses are also available for most titles. For more information, reference our Special Bulk SaleseBook Licensing web page at www.apress.com/bulk-sales .

Any source code or other supplementary materials referenced by the author in this text is available to readers at www.apress.com . For detailed information about how to locate your books source code, go to www.apress.com/source-code/ .

For my grandmother, Ann Biango, who passed away during the creation of this book. I was very lucky to have her in my life for as long as I did.

Contents at a Glance

Picture 4

Picture 5

Picture 6

Picture 7

Picture 8

Picture 9

Picture 10

Picture 11

Picture 12

Contents

Picture 13

Picture 14

Picture 15

Picture 16

Picture 17

Picture 18

About the Author Tom Barker is the Senior Manager of Web Development at C - photo 19

About the Author Tom Barker is the Senior Manager of Web Development at - photo 20

About the Author Tom Barker is the Senior Manager of Web Development at - photo 21

About the Author

Tom Barker is the Senior Manager of Web Development at Comcast He has authored - photo 22

Tom Barker is the Senior Manager of Web Development at Comcast. He has authored Pro JavaScript Performance: Monitoring and Visualization and co-authored Foundation Website Creation with HTML5, CSS3, and JavaScript. Tom has also served as an adjunct professor at Philadelphia University for the last 10 years. He lives outside of Philadelphia with his wife and two children.

About the Technical Reviewer

Matthew Canning is an author speaker and experienced technical leader who has - photo 23

Matthew Canning is an author, speaker, and experienced technical leader who has served in engineering and management roles at some of the worlds largest companies. Aside from technology, he writes and presents on subjects such as memory, mental calculation, and productivity. He currently lives outside Philadelphia with his wife and daughter.

Twitter:

Web site: matthewcanning.com

Acknowledgments

I want to thank Ben Renow-Clarke for thinking of me for this great project. I want to thank Matthew Moodie and Christine Rickets and the rest of the team at Apress for their guidance and direction. I want to thank Matt Canning for helping me see the code with fresh eyes and for keeping me honest.

I want to thank my team at Comcast: every one of you is amazing and I am made better by being a part of such an incredible team.

Next page
Light

Font size:

Reset

Interval:

Bookmark:

Make

Similar books «Pro Data Visualization using R and JavaScript»

Look at similar books to Pro Data Visualization using R and JavaScript. We have selected literature similar in name and meaning in the hope of providing readers with more options to find new, interesting, not yet read works.


Reviews about «Pro Data Visualization using R and JavaScript»

Discussion, reviews of the book Pro Data Visualization using R and JavaScript and just readers' own opinions. Leave your comments, write what you think about the work, its meaning or the main characters. Specify what exactly you liked and what you didn't like, and why you think so.