• Complain

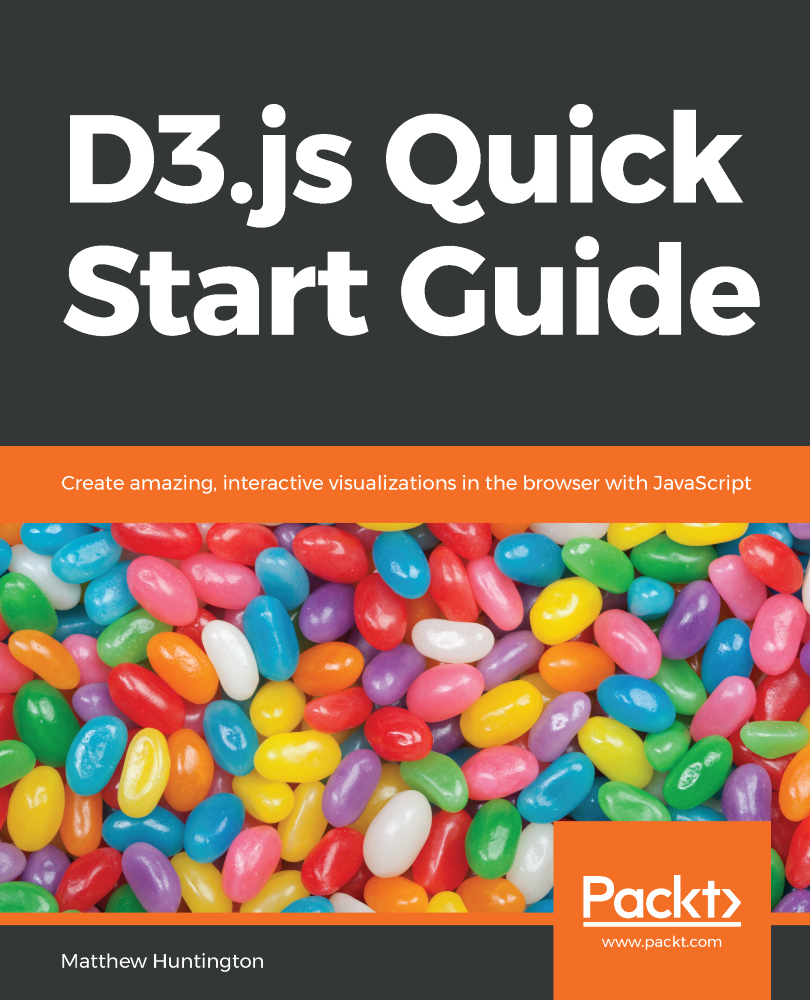
Matthew Huntington - D3.js Quick Start Guide: Create amazing, interactive visualizations in the browser with JavaScript

Here you can read online Matthew Huntington - D3.js Quick Start Guide: Create amazing, interactive visualizations in the browser with JavaScript full text of the book (entire story) in english for free. Download pdf and epub, get meaning, cover and reviews about this ebook. year: 2018, publisher: Packt Publishing, genre: Home and family. Description of the work, (preface) as well as reviews are available. Best literature library LitArk.com created for fans of good reading and offers a wide selection of genres:

Romance novel Science fiction Adventure Detective Science History Home and family Prose Art Politics Computer Non-fiction Religion Business Children Humor

Choose a favorite category and find really read worthwhile books. Enjoy immersion in the world of imagination, feel the emotions of the characters or learn something new for yourself, make an fascinating discovery.

No cover
  • Book:
    D3.js Quick Start Guide: Create amazing, interactive visualizations in the browser with JavaScript
  • Author:
  • Publisher:
    Packt Publishing
  • Genre:
  • Year:
    2018
  • Rating:
    4 / 5
  • Favourites:
    Add to favourites
  • Your mark:
    • 80
    • 1
    • 2
    • 3
    • 4
    • 5

D3.js Quick Start Guide: Create amazing, interactive visualizations in the browser with JavaScript: summary, description and annotation

We offer to read an annotation, description, summary or preface (depends on what the author of the book "D3.js Quick Start Guide: Create amazing, interactive visualizations in the browser with JavaScript" wrote himself). If you haven't found the necessary information about the book — write in the comments, we will try to find it.

This book will help you build interactive graphs that are viewable in any web browser using JavaScript, D3.js, and SVG. You will learn how to make a scatter plot, a bar graph, a pie chart, a force directed graph, and a map.

Key Features
  • Takes you through the most common graphs youll need
  • Add interactivity to your visualizations
  • Easy to follow builds
  • Book Description

    D3.js is a JavaScript library that allows you to create graphs and data visualizations in the browser with HTML, SVG, and CSS. This book will take you from the basics of D3.js, so that you can create your own interactive visualizations, to creating the most common graphs that you will encounter as a developer, scientist, statistician, or data scientist.

    The book begins with an overview of SVG, the basis for creating two-dimensional graphics in the browser. Once the reader has a firm understanding of SVG, we will tackle the basics of how to use D3.js to connect data to our SVG elements. We will start with a scatter plot that maps run data to circles on a graph, and expand our scatter plot to make it interactive. You will see how you can easily allow the users of your graph to create, edit, and delete run data by simply dragging and clicking the graph. Next, we will explore creating a bar graph, using external data from a mock API.

    After that, we will explore animations and motion with a bar graph, and use various physics-based forces to create a force-directed graph. Finally, we will look at how to use GeoJSON data to create a map.

    What you will learn
  • Build a scatter plot
  • Build a bar graph
  • Build a pie chart
  • Build a force-directed graph
  • Build a map
  • Build interactivity into your graphs
  • Who this book is for

    This book is for web developers, interactive news developers, data scientists, and anyone interested in representing data through interactive visualizations on the Web with D3. Some basic knowledge of JavaScript is expected, but no prior experience with data visualization or D3 is required to follow this book.

    Matthew Huntington: author's other books


    Who wrote D3.js Quick Start Guide: Create amazing, interactive visualizations in the browser with JavaScript? Find out the surname, the name of the author of the book and a list of all author's works by series.

    D3.js Quick Start Guide: Create amazing, interactive visualizations in the browser with JavaScript — read online for free the complete book (whole text) full work

    Below is the text of the book, divided by pages. System saving the place of the last page read, allows you to conveniently read the book "D3.js Quick Start Guide: Create amazing, interactive visualizations in the browser with JavaScript" online for free, without having to search again every time where you left off. Put a bookmark, and you can go to the page where you finished reading at any time.

    Light

    Font size:

    Reset

    Interval:

    Bookmark:

    Make
    D3js Quick Start Guide Create amazing interactive visualizations in the - photo 1
    D3.js Quick Start Guide
    Create amazing, interactive visualizations in the browser
    with JavaScript
    Matthew Huntington
    BIRMINGHAM - MUMBAI D3js Quick Start Guide Copyright 2018 Packt Publishing - photo 2
    BIRMINGHAM - MUMBAI
    D3.js Quick Start Guide

    Copyright 2018 Packt Publishing

    All rights reserved. No part of this book may be reproduced, stored in a retrieval system, or transmitted in any form or by any means, without the prior written permission of the publisher, except in the case of brief quotations embedded in critical articles or reviews.

    Every effort has been made in the preparation of this book to ensure the accuracy of the information presented. However, the information contained in this book is sold without warranty, either express or implied. Neither the author(s), nor Packt Publishing or its dealers and distributors, will be held liable for any damages caused or alleged to have been caused directly or indirectly by this book.

    Packt Publishing has endeavored to provide trademark information about all of the companies and products mentioned in this book by the appropriate use of capitals. However, Packt Publishing cannot guarantee the accuracy of this information.

    Commissioning Editor: Kunal Chaudari
    Acquisition Editor: Noyonika Das
    Content Development Editor: Mohammed Yusuf Imaratwale
    Technical Editor: Sushmeeta Jena
    Copy Editor: Safis Editing
    Project Coordinator: Hardik Bhinde
    Proofreader: Safis Editing
    Indexer: Rekha Nair
    Graphics: Alishon Mendonsa
    Production Coordinator: Shantanu Zagade

    First published: September 2018

    Production reference: 1260918

    Published by Packt Publishing Ltd.
    Livery Place
    35 Livery Street
    Birmingham
    B3 2PB, UK.

    ISBN 978-1-78934-238-3

    www.packtpub.com

    maptio Mapt is an online digital library that gives you full access to over - photo 3
    mapt.io

    Mapt is an online digital library that gives you full access to over 5,000 books and videos, as well as industry leading tools to help you plan your personal development and advance your career. For more information, please visit our website.

    Why subscribe?
    • Spend less time learning and more time coding with practical eBooks and Videos from over 4,000 industry professionals

    • Improve your learning with Skill Plans built especially for you

    • Get a free eBook or video every month

    • Mapt is fully searchable

    • Copy and paste, print, and bookmark content

    Packt.com

    Did you know that Packt offers eBook versions of every book published, with PDF and ePub files available? You can upgrade to the eBook version at www.packt.com and as a print book customer, you are entitled to a discount on the eBook copy. Get in touch with us at customercare@packtpub.com for more details.

    At www.packt.com , you can also read a collection of free technical articles, sign up for a range of free newsletters, and receive exclusive discounts and offers on Packt books and eBooks.

    Contributors
    About the author

    Matthew Huntington has worked as a developer for about 15 years now, and has a full understanding of all aspects of development (server side, client side, and mobile). He graduated magna cum laude from Vassar College with a degree in computer science in which he received departmental honors. He's worked for many clients in New York, including Nike, IBM, Pfizer, MTV, Chanel, Verizon, Goldman Sachs, Nestle, AARP, and BAM. He's worked with companies in pretty much all of the major industries applicable to development, and he has a deep understanding of the differences in the ways those industries work.

    As an instructor, Matt has been teaching full-time since 2015 at General Assembly and has lead workshops at many locations, including prestigious universities such as Columbia University and NYU.

    About the reviewer

    Xun (Brian) Wu is the Founder and CEO of smartchart.tech. He has over 16 years of extensive hands-on experience in design and development with Blockchain, big data, Cloud, UI, and system infrastructure. He is the coauthor of Blockchain By Example, Hyperledger cookbook, Blockchain Quick Start Guide, and Seven NoSQL Databases in a Week. He has also been a technical reviewer for over 40 books for Packt. He served as a board advisor for several blockchain startups and owned several patents on blockchain. He holds a Master's in computer science from NJIT and lives in New Jersey with his two beautiful daughters, Bridget and Charlotte.

    I would like to thank my parents, wife, and kids for their patience and support throughout this endeavor.

    Nikita Rokotyan is a data visualization engineer with a background in physics and creative technologies. He specializes in creating enriched, data-driven experiences with strong dynamic and interactive components.

    Focusing on aesthetics and information content, Nikita has worked on a number of applied and artistic data visualizations for various startups as well as large organizations such as University of Tokyo, Proctor & Gamble, and the Paul Mellon Centre for Studies in British Art.

    Currently he's running a data visualization studio Interacta and co-running a company in NYCCultivateMethat explores how data visualization can help with a better understanding and cultivating human talent

    Packt is searching for authors like you

    If you're interested in becoming an author for Packt, please visit authors.packtpub.com and apply today. We have worked with thousands of developers and tech professionals, just like you, to help them share their insight with the global tech community. You can make a general application, apply for a specific hot topic that we are recruiting an author for, or submit your own idea.

    Preface

    Welcome to D3.js Quick Start Guide. In it, we'll be covering the basics of D3 through a series of large builds. By the end, you should have a strong enough grasp of the library to go out and build your own interactive data visualizations.

    Who this book is for

    This book is for junior-to senior-level frontend and full-stack web developers who are interested in getting to data visualization. The reader needs to have a basic understanding of HTML, CSS, JavaScript, AJAX, and what a server is, in order to be able to work with the code and concepts given in this book.

    What this book covers

    , Getting Started with D3.js, provides a high-level overview of what makes D3 so interesting. We examine what an SVG element is and set up our machine so that it is ready to create D3 code. We also take a look at this book's approach to learning and how it applies to the applications that we'll build.

    , Using SVG to Create Images Using Code, covers the basics of SVG (base tags, basic elements, positioning, and styling). We also look at Bezier curves and how to draw organic shapes with them. We're now ready to learn how D3 can be used to modify these elements .

    Next page
    Light

    Font size:

    Reset

    Interval:

    Bookmark:

    Make

    Similar books «D3.js Quick Start Guide: Create amazing, interactive visualizations in the browser with JavaScript»

    Look at similar books to D3.js Quick Start Guide: Create amazing, interactive visualizations in the browser with JavaScript. We have selected literature similar in name and meaning in the hope of providing readers with more options to find new, interesting, not yet read works.


    Reviews about «D3.js Quick Start Guide: Create amazing, interactive visualizations in the browser with JavaScript»

    Discussion, reviews of the book D3.js Quick Start Guide: Create amazing, interactive visualizations in the browser with JavaScript and just readers' own opinions. Leave your comments, write what you think about the work, its meaning or the main characters. Specify what exactly you liked and what you didn't like, and why you think so.