• Complain

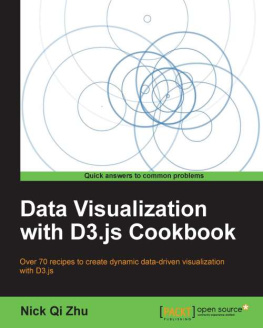
Nick Zhu - Data Visualization with D3 4.x Cookbook

Here you can read online Nick Zhu - Data Visualization with D3 4.x Cookbook full text of the book (entire story) in english for free. Download pdf and epub, get meaning, cover and reviews about this ebook. year: 2017, publisher: Packt Publishing, genre: Computer. Description of the work, (preface) as well as reviews are available. Best literature library LitArk.com created for fans of good reading and offers a wide selection of genres:

Romance novel Science fiction Adventure Detective Science History Home and family Prose Art Politics Computer Non-fiction Religion Business Children Humor

Choose a favorite category and find really read worthwhile books. Enjoy immersion in the world of imagination, feel the emotions of the characters or learn something new for yourself, make an fascinating discovery.

Nick Zhu Data Visualization with D3 4.x Cookbook
  • Book:
    Data Visualization with D3 4.x Cookbook
  • Author:
  • Publisher:
    Packt Publishing
  • Genre:
  • Year:
    2017
  • Rating:
    3 / 5
  • Favourites:
    Add to favourites
  • Your mark:
    • 60
    • 1
    • 2
    • 3
    • 4
    • 5

Data Visualization with D3 4.x Cookbook: summary, description and annotation

We offer to read an annotation, description, summary or preface (depends on what the author of the book "Data Visualization with D3 4.x Cookbook" wrote himself). If you haven't found the necessary information about the book — write in the comments, we will try to find it.

Key Features
  • Learn about D3 4.0 from the inside out and master its new features
  • Utilize D3 packages to generate graphs, manipulate data, and create beautiful presentations
  • Solve real-world visualization problems with the help of practical recipes
Book Description

This book gives you all the guidance you need to start creating modern data visualizations with D3 4.x that take advantage of the latest capabilities of JavaScript.

The book starts with the basic D3 structure and building blocks and quickly moves on to writing idiomatic D3-style JavaScript code. You will learn how to work with selection to target certain visual elements on the page, then you will see techniques to represent data both in programming constructs and its visual metaphor. You will learn how map values in your data domain to the visual domain using scales, and use the various shape functions supported by D3 to create SVG shapes in visualizations.

Moving on, you ll see how to use and customize various D3 axes and master transition to add bells and whistles to otherwise dry visualizations. You ll also learn to work with charts, hierarchy, graphs, and build interactive visualizations. Next you ll work with Force, which is one of the most awe-inspiring techniques you can add to your visualizations, and you ll implement a fully functional Choropleth map (a special purpose colored map) in D3.

Finally, you ll learn to unit test data visualization code and test-driven development in a visualization project so you know how to produce high-quality D3 code.

What you will learn
  • Get a solid understanding of the D3 fundamentals and idioms
  • Use D3 to load, manipulate, and map data to any kind of visual representation on the web
  • Create data-driven dynamic visualizations that update as the data does
  • Leverage the various modules provided by D3 to create sophisticated, dynamic, and interactive charts and graphics
  • Create data-driven transitions and animations within your visualizations
  • Understand and leverage more advanced concepts such as force, touch, and Geo data visualizations
About the Author

Nick Zhu is a professional programmer and data engineer with more than a decade experience in software development, big data, and machine learning. Currently, he is one of the founders and CTO of Yroo.com - meta search engine for online shopping. He is also the creator of dc.js a popular multidimensional charting library built on D3.

Table of Contents
  1. Getting Started with D3.js
  2. Be Selective
  3. Dealing with Data
  4. Tipping the Scales
  5. Playing with Axes
  6. Transition with Style
  7. Getting into Shape
  8. Chart Them Up
  9. Lay Them Out
  10. Interacting with Your Visualization
  11. Using Force
  12. Knowing Your Map
  13. Test Drive Your Visualization
  14. Building Interactive Analytics in Minutes

Nick Zhu: author's other books


Who wrote Data Visualization with D3 4.x Cookbook? Find out the surname, the name of the author of the book and a list of all author's works by series.

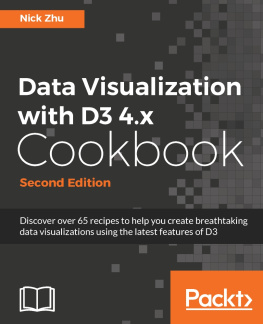
Data Visualization with D3 4.x Cookbook — read online for free the complete book (whole text) full work

Below is the text of the book, divided by pages. System saving the place of the last page read, allows you to conveniently read the book "Data Visualization with D3 4.x Cookbook" online for free, without having to search again every time where you left off. Put a bookmark, and you can go to the page where you finished reading at any time.

Light

Font size:

Reset

Interval:

Bookmark:

Make
Data Visualization with D3 4.x Cookbook - Second Edition

Data Visualization with D3 4.x Cookbook - Second Edition

Copyright 2017 Packt Publishing

All rights reserved. No part of this book may be reproduced, stored in a retrieval system, or transmitted in any form or by any means, without the prior written permission of the publisher, except in the case of brief quotations embedded in critical articles or reviews.

Every effort has been made in the preparation of this book to ensure the accuracy of the information presented. However, the information contained in this book is sold without warranty, either express or implied. Neither the author(s), nor Packt Publishing, and its dealers and distributors will be held liable for any damages caused or alleged to be caused directly or indirectly by this book.

Packt Publishing has endeavored to provide trademark information about all of the companies and products mentioned in this book by the appropriate use of capitals. However, Packt Publishing cannot guarantee the accuracy of this information.

First published: October 2013

Second edition: February 2017

Production reference: 1220217

Published by Packt Publishing Ltd.

Livery Place

35 Livery Street

Birmingham

B3 2PB, UK.

ISBN 978-1-78646-825-3

www.packtpub.com

Credits

Author

Nick Zhu

Copy Editor

Dhanya Baburaj

Reviewer

Scott Becker

Project Coordinator

Ritika Manoj

Commissioning Editor

Wilson Dsouza

Proofreader

Safis Editing

Acquisition Editor

Shweta Pant

Indexer

Mariammal Chettiyar

Content Development Editor

Arun Nadar

Graphics

Jason Monteiro

Technical Editor

Sachit Bedi

Production Coordinator

Deepika Naik

About the Author

Nick Zhuis a professional programmer and data engineer with more than a decade experience in software development, big data, and machine learning. Currently, he is one of the founders and CTO of Yroo.com - meta search engine for online shopping. He is also the creator of dc.jsa popular multidimensional charting library built on D3.

About the Reviewer

Scott Beckeris a partner at Olio Apps, a software consulting company in Portland Oregon. He has built numerous systems including a marketplace for geospatial datasets, HIPAA compliant video services for the medical industry, and visualizations of breaches in data security products. He is currently building a next generation time tracking system at www.shoutbase.com . He has also produced a video course on data visualization with D3.js available at deveo.tv .

www.PacktPub.com

For support files and downloads related to your book, please visit www.PacktPub.com .

Did you know that Packt offers eBook versions of every book published, with PDF and ePub files available? You can upgrade to the eBook version at www.PacktPub.com and as a print book customer, you are entitled to a discount on the eBook copy. Get in touch with us at service@packtpub.com for more details.

At www.PacktPub.com , you can also read a collection of free technical articles, sign up for a range of free newsletters and receive exclusive discounts and offers on Packt books and eBooks.

httpswwwpacktpubcommapt Get the most in-demand software skills with - photo 1
Next page
Light

Font size:

Reset

Interval:

Bookmark:

Make

Similar books «Data Visualization with D3 4.x Cookbook»

Look at similar books to Data Visualization with D3 4.x Cookbook. We have selected literature similar in name and meaning in the hope of providing readers with more options to find new, interesting, not yet read works.


Reviews about «Data Visualization with D3 4.x Cookbook»

Discussion, reviews of the book Data Visualization with D3 4.x Cookbook and just readers' own opinions. Leave your comments, write what you think about the work, its meaning or the main characters. Specify what exactly you liked and what you didn't like, and why you think so.