• Complain

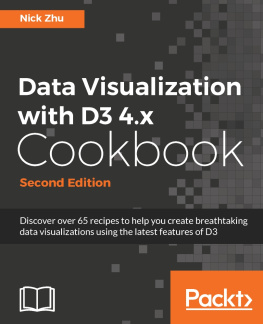
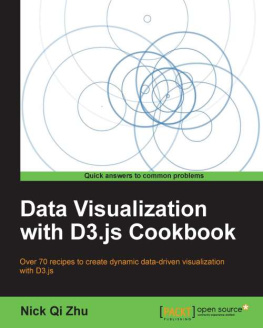
Nick Qi Zhu - Data Visualization with D3.js Cookbook

Here you can read online Nick Qi Zhu - Data Visualization with D3.js Cookbook full text of the book (entire story) in english for free. Download pdf and epub, get meaning, cover and reviews about this ebook. year: 2013, publisher: PACKT, genre: Home and family. Description of the work, (preface) as well as reviews are available. Best literature library LitArk.com created for fans of good reading and offers a wide selection of genres:

Romance novel Science fiction Adventure Detective Science History Home and family Prose Art Politics Computer Non-fiction Religion Business Children Humor

Choose a favorite category and find really read worthwhile books. Enjoy immersion in the world of imagination, feel the emotions of the characters or learn something new for yourself, make an fascinating discovery.

Nick Qi Zhu Data Visualization with D3.js Cookbook
  • Book:
    Data Visualization with D3.js Cookbook
  • Author:
  • Publisher:
    PACKT
  • Genre:
  • Year:
    2013
  • Rating:
    4 / 5
  • Favourites:
    Add to favourites
  • Your mark:
    • 80
    • 1
    • 2
    • 3
    • 4
    • 5

Data Visualization with D3.js Cookbook: summary, description and annotation

We offer to read an annotation, description, summary or preface (depends on what the author of the book "Data Visualization with D3.js Cookbook" wrote himself). If you haven't found the necessary information about the book — write in the comments, we will try to find it.

D3.js is a javascript library designed to display digital data in dynamic graphical form. It helps you bring data to life using HTML, SVG, and CSS. D3 allows great control over the final visual result, and it is the hottest and most powerful web-based data visualization technology on the market today. Data Visualization with D3.js Cookbook is packed with practical recipes to help you learn every aspect of data visualization with D3. Data Visualization with D3.js Cookbook is designed to provide you with all the guidance you need to get to grips with data visualization with D3. With this book, you will create breathtaking data visualization with professional efficiency and precision with the help of practical recipes, illustrations, and code samples. Data Visualization with D3.js Cookbook starts off by touching upon data visualization and D3 basics before gradually taking you through a number of practical recipes covering a wide range of topics you need to know about D3. You will learn the fundamental concepts of data visualization, functional javascript, and D3 fundamentals including element selection, data binding, animation, and SVG generation. You will also learn how to leverage more advanced techniques such as custom interpolators, custom tweening, timers, the layout manager, force manipulation, and so on. This book also provides a number of pre-built chart recipes with ready-to-go sample code to help you bootstrap quickly.

Nick Qi Zhu: author's other books


Who wrote Data Visualization with D3.js Cookbook? Find out the surname, the name of the author of the book and a list of all author's works by series.

Data Visualization with D3.js Cookbook — read online for free the complete book (whole text) full work

Below is the text of the book, divided by pages. System saving the place of the last page read, allows you to conveniently read the book "Data Visualization with D3.js Cookbook" online for free, without having to search again every time where you left off. Put a bookmark, and you can go to the page where you finished reading at any time.

Light

Font size:

Reset

Interval:

Bookmark:

Make
Data Visualization with D3.js Cookbook

Data Visualization with D3.js Cookbook

Copyright 2013 Packt Publishing

All rights reserved. No part of this book may be reproduced, stored in a retrieval system, or transmitted in any form or by any means, without the prior written permission of the publisher, except in the case of brief quotations embedded in critical articles or reviews.

Every effort has been made in the preparation of this book to ensure the accuracy of the information presented. However, the information contained in this book is sold without warranty, either express or implied. Neither the author, nor Packt Publishing, and its dealers and distributors will be held liable for any damages caused or alleged to be caused directly or indirectly by this book.

Packt Publishing has endeavored to provide trademark information about all of the companies and products mentioned in this book by the appropriate use of capitals. However, Packt Publishing cannot guarantee the accuracy of this information.

First published: October 2013

Production Reference: 1171013

Published by Packt Publishing Ltd.

Livery Place

35 Livery Street

Birmingham B3 2PB, UK.

ISBN 978-1-78216-216-2

www.packtpub.com

Cover Image by Martin Bell (<>)

Credits

Author

Nick Qi Zhu

Reviewers

Andrew Berls

Kevin Coughlin

Ismini Lourentzou

Pablo Navarro

Acquisition Editor

Martin Bell

Lead Technical Editor

Sweny M. Sukumaran

Technical Editors

Akashdeep Kundu

Proshonjit Mitra

Sonali S. Vernekar

Project Coordinator

Kranti Berde

Proofreader

Mario Cecere

Indexer

Tejal Soni

Graphics

Yuvraj Mannari

Production Coordinator

Aditi Gajjar

Cover Work

Aditi Gajjar

About the Author

Nick Qi Zhu is a professional programmer and visualization enthusiast with more than a decade of experience in software development. He is the author of dc.jsa popular multi-dimensional charting library built on D3. Currently he is having fun and learning as a lead consultant at ThoughtWorks.

I would like to thank the folks at Packt Publishing for supporting me through my journey, especially my editors Martin Bell and Sweny Sukumaran for polishing up my prose making this book much easier to read. And many thanks to my technical reviewers who had really made this book a much better one through their constructive criticism.

Finally to my wife Sherry for being supportive and incredibly patient with me through the last several months; without her support this book would not be possible.

About the Reviewers

Andrew Berls is a Ruby and JavaScript developer and lives in Santa Barbara, CA. He's been building websites ever since he learned what an HTML tag was, and has since fallen in love with full-stack application development. He was recently an intern at Causes.com, where he developed data dashboards using D3.js for visualizing social networks. Andrew is completing his degree in Computer Science at the University of California, Santa Barbara, and when he's not programming you can find him learning to cook (badly) or hiking up a mountain somewhere.

Kevin Coughlin holds both Computer Science and Economics degrees from The College of New Jersey. He is a JavaScript developer with over two years of industry experience. At work and at home, Kevin combines HTML5 standards with cutting-edge client- and server-side technologies such as Angular.js, Backbone.js, and Node.js to produce effective modern solutions for the open web.

Kevin regularly posts tutorials on emerging web technologies on his website http://kevintcoughlin.com.

Ismini Lourentzou has a Business Administration B.Sc. and a long-standing career in the banking sector, at National Bank of Greece. Learning programming in Java in her spare time and her continuous urge for novelty, drove her to pursue a second degree in Computer Science from Athens University of Economics and Business (AUEB). During her undergraduate studies, she has participated in the Knowledge Discovery and Data Mining Cup 2012, as a member of the Data and Web Mining Group of AUEB, headed by Professor Michalis Vazirgiannis, and worked on "Automated Snippet Generation of Online Advertising", which led to a publication at CIKM 2013. Meanwhile, she also participated at ImageClef 2013 as a member of the Information Retrieval Group of AUEB, headed by Professor Theodore Kalamboukis. Their participation was placed second in the Textual Ad-hoc image-based retrieval and fifth in Visual Ad-hoc image-based retrieval. Due to her love for research and programming, there was no doubt about changing her career orientation; she is currently a PhD student at University of Illinois at Urbana Champaign, combining Machine Learning and Information Retrieval in developing intelligent information systems that will improve a user's productivity by decreasing the amount of manual involvement in searching, organizing, and understanding information from mainly textual sources. After completing her PhD, she hopes to continue working in research, and to be able to learn more and more each day.

I would like to thank my family for their support and help, for always being there to motivate me, my mother for taking care of me while my free time was nonexistent, my sister that is always protective of me, my father to being present during difficult situations. Moreover, I am thankful for my boyfriend for his everlasting patience and love and my friends for their advices and help during this process.

Pablo Navarro is a data visualization consultant from Chile. He earned his Master's degree in Applied Mathematics from cole des Mines de Saint-Etienne, France. After working for some years in operations research and data analysis, he decided to specialize in data visualization for web platforms, in which he currently works. In his free time, he enjoys doing watercolor illustrations, running and reading about human evolution. His most recent works can be seen at http://pnavarrc.github.io.

www.PacktPub.com
Support files, eBooks, discount offers and more

You might want to visit www.PacktPub.com for support files and downloads related to your book.

Did you know that Packt offers eBook versions of every book published, with PDF and ePub files available? You can upgrade to the eBook version at > for more details.

At www.PacktPub.com, you can also read a collection of free technical articles, sign up for a range of free newsletters and receive exclusive discounts and offers on Packt books and eBooks.

httpPacktLibPacktPubcom Do you need instant solutions to your IT - photo 1

http://PacktLib.PacktPub.com

Do you need instant solutions to your IT questions? PacktLib is Packt's online digital book library. Here, you can access, read and search across Packt's entire library of books.

Why Subscribe?
  • Fully searchable across every book published by Packt
  • Copy and paste, print and bookmark content
  • On demand and accessible via web browser
Free Access for Packt account holders

If you have an account with Packt at www.PacktPub.com, you can use this to access PacktLib today and view nine entirely free books. Simply use your login credentials for immediate access.

Next page
Light

Font size:

Reset

Interval:

Bookmark:

Make

Similar books «Data Visualization with D3.js Cookbook»

Look at similar books to Data Visualization with D3.js Cookbook. We have selected literature similar in name and meaning in the hope of providing readers with more options to find new, interesting, not yet read works.


Reviews about «Data Visualization with D3.js Cookbook»

Discussion, reviews of the book Data Visualization with D3.js Cookbook and just readers' own opinions. Leave your comments, write what you think about the work, its meaning or the main characters. Specify what exactly you liked and what you didn't like, and why you think so.