• Complain

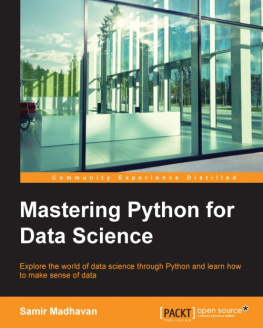
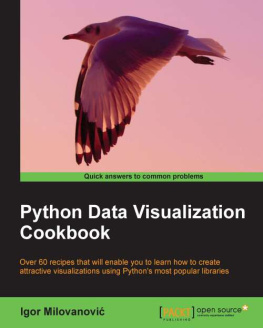
Igor Milovanovic - Python Data Visualization Cookbook

Here you can read online Igor Milovanovic - Python Data Visualization Cookbook full text of the book (entire story) in english for free. Download pdf and epub, get meaning, cover and reviews about this ebook. year: 2013, publisher: Packt Publishing, genre: Computer. Description of the work, (preface) as well as reviews are available. Best literature library LitArk.com created for fans of good reading and offers a wide selection of genres:

Romance novel Science fiction Adventure Detective Science History Home and family Prose Art Politics Computer Non-fiction Religion Business Children Humor

Choose a favorite category and find really read worthwhile books. Enjoy immersion in the world of imagination, feel the emotions of the characters or learn something new for yourself, make an fascinating discovery.

Igor Milovanovic Python Data Visualization Cookbook
  • Book:
    Python Data Visualization Cookbook
  • Author:
  • Publisher:
    Packt Publishing
  • Genre:
  • Year:
    2013
  • Rating:
    3 / 5
  • Favourites:
    Add to favourites
  • Your mark:
    • 60
    • 1
    • 2
    • 3
    • 4
    • 5

Python Data Visualization Cookbook: summary, description and annotation

We offer to read an annotation, description, summary or preface (depends on what the author of the book "Python Data Visualization Cookbook" wrote himself). If you haven't found the necessary information about the book — write in the comments, we will try to find it.

Over 60 recipes that will enable you to learn how to create attractive visualizations using Pythons most popular libraries

Overview

  • Learn how to set up an optimal Python environment for data visualization
  • Understand the topics such as importing data for visualization and formatting data for visualization
  • Understand the underlying data and how to use the right visualizations

In Detail

Today, data visualization is a hot topic as a direct result of the vast amount of data created every second. Transforming that data into information is a complex task for data visualization professionals, who, at the same time, try to understand the data and objectively transfer that understanding to others. This book is a set of practical recipes that strive to help the reader get a firm grasp of the area of data visualization using Python and its popular visualization and data libraries.

Python Data Visualization Cookbook will progress the reader from the point of installing and setting up a Python environment for data manipulation and visualization all the way to 3D animations using Python libraries. Readers will benefit from over 60 precise and reproducible recipes that guide the reader towards a better understanding of data concepts and the building blocks for subsequent and sometimes more advanced concepts.

Python Data Visualization Cookbook starts by showing you how to set up matplotlib and the related libraries that are required for most parts of the book, before moving on to discuss some of the lesser-used diagrams and charts such as Gantt Charts or Sankey diagrams. During the book, we go from simple plots and charts to more advanced ones, thoroughly explaining why we used them and how not to use them. As we go through the book, we will also discuss 3D diagrams. We will peep into animations just to show you what it takes to go into that area. Maps are irreplaceable for displaying geo-spatial data, so we also show you how to build them. In the last chapter, we show you how to incorporate matplotlib into different environments, such as a writing system, LaTeX, or how to create Gantt charts using Python.

This book will help those who already know how to program in Python to explore a new field one of data visualization. As this book is all about recipes that explain how to do something, code samples are abundant, and they are followed by visual diagrams and charts to help you understand the logic and compare your own results with what is explained in the book.

What you will learn from this book

  • Install and use iPython
  • Use Pythons virtual environments
  • Install and customize NumPy and matplotlib
  • Draw common and advanced plots
  • Visualize data using maps
  • Create 3D animated data visualizations
  • Import data from various formats
  • Export data from various formats

Approach

This book is written in a Cookbook style targeted towards an advanced audience. It covers the advanced topics of data visualization in Python.

Igor Milovanovic: author's other books


Who wrote Python Data Visualization Cookbook? Find out the surname, the name of the author of the book and a list of all author's works by series.

Python Data Visualization Cookbook — read online for free the complete book (whole text) full work

Below is the text of the book, divided by pages. System saving the place of the last page read, allows you to conveniently read the book "Python Data Visualization Cookbook" online for free, without having to search again every time where you left off. Put a bookmark, and you can go to the page where you finished reading at any time.

Light

Font size:

Reset

Interval:

Bookmark:

Make
Python Data Visualization Cookbook

Python Data Visualization Cookbook

Copyright 2013 Packt Publishing

All rights reserved. No part of this book may be reproduced, stored in a retrieval system, or transmitted in any form or by any means, without the prior written permission of the publisher, except in the case of brief quotations embedded in critical articles or reviews.

Every effort has been made in the preparation of this book to ensure the accuracy of the information presented. However, the information contained in this book is sold without warranty, either express or implied. Neither the author, nor Packt Publishing, and its dealers and distributors will be held liable for any damages caused or alleged to be caused directly or indirectly by this book.

Packt Publishing has endeavored to provide trinformation about all of the companies and products mentioned in this book by the appropriate use of capitals. However, Packt Publishing cannot guarantee the accuracy of this information.

First published: November 2013

Production Reference: 1191113

Published by Packt Publishing Ltd.

Livery Place

35 Livery Street

Birmingham B3 2PB, UK.

ISBN 978-1-78216-336-7

www.packtpub.com

Cover Image by Gorkee Bhardwaj (<>)

Credits

Author

Igor Milovanovi

Reviewers

Tarek Amr

Simeone Franklin

Jayesh K. Gupta

Kostiantyn Kucher

Kenneth Emeka Odoh

Acquisition Editor

James Jones

Lead Technical Editor

Ankita Shashi

Technical Editors

Pratik More

Amit Ramadas

Ritika Singh

Copy Editors

Brandt D'Mello

Janbal Dharmaraj

Deepa Nambiar

Kirti Pai

Laxmi Subramanian

Project Coordinator

Rahul Dixit

Proofreaders

Amy Johnson

Lindsey Thomas

Indexer

Mariammal Chettiyar

Graphics

Abhinash Sahu

Production Coordinator

Shantanu Zagade

Cover Work

Shantanu Zagade

About the Author

Igor Milovanovi is an experienced developer with a strong background in Linux system and software engineering. He has skills in building scalable data-driven distributed software-rich systems.

He is an Evangelist for high-quality systems design who holds strong interests in software architecture and development methodologies. He is always persistent on advocating methodologies that promote high-quality software, such as test-driven development, one-step builds, and continuous integration.

He also possesses solid knowledge of product development. Having field experience and official training, he is capable of transferring knowledge and communication flow from business to developers and vice versa.

I am most grateful to my fiance for letting me spend endless hours on the work instead with her and for being an avid listener to my endless book monologues. I want to also thank my brother for always being my strongest supporter. I am thankful to my parents for letting me develop myself in various ways and become the person I am today.

I could not write this book without enormous energy from open source community that developed Python, matplotlib, and all libraries that we have used in this book. I owe the most to the people behind all these projects. Thank you.

About the Reviewers

Tarek Amr achieved his postgraduate degree in Data Mining and Information Retrieval from the University of East Anglia. He has about 10 years' experience in Software Development. He has been volunteering in Global Voices Online (GVO) since 2007, and currently he is the local ambassador of the Open Knowledge Foundation (OKFN) in Egypt. Words such as Open Data, Government 2.0, Data Visualisation, Data Journalism, Machine Learning, and Natural Language Processing are like music to his ears.

Tarek's Twitter handle is @gr33ndata and his homepage is http://tarekamr.appspot.com/.

Jayesh K. Gupta is the Lead Developer of Matlab Toolbox for Biclustering Analysis (MTBA). He is currently an undergraduate student and researcher at IIT Kanpur. His interests lie in the field of pattern recognition. His interests also lie in basic sciences, recognizing them as the means of analyzing patterns in nature. Coming to IIT, he realized how this analysis is being augmented by Machine Learning algorithms with various diverse applications. He believes that augmenting human thought with machine intelligence is one of the best ways to advance human knowledge. He is a long time technophile and a free-software Evangelist. He usually goes by the handle, rejuvyesh online. He is also an avid reader and his books can be checked out at Goodreads. Checkout his projects at Bitbucket and GitHub. For all links visit >.

Kostiantyn Kucher was born in Odessa, Ukraine. He received his Master's degree in Computer Science from Odessa National Polytechnic University in 2012. He used Python as well as Matplotlib and PIL for Machine Learning and Image Recognition purposes.

Currently, Kostiantyn is a PhD student in Computer Science specializing in Information Visualization. He conducts his research under the supervision of Prof. Dr. Andreas Kerren with the ISOVIS group at the Computer Science Department of Linnaeus University (Vxj, Sweden).

Kenneth Emeka Odoh performs research on state of the art Data Visualization techniques. His research interest includes exploratory search where the users are guided to their search results using visual clues.

Kenneth is proficient in Python programming. He has presented a Python conference talk at Pycon, Finland in 2012 where he spoke about Data Visualization in Django to a packed audience.

He currently works as a Graduate Researcher at the University of Regina, Canada. He is a polyglot with experience in developing applications in C, C++, Python, and Java programming languages.

When Kenneth is not writing source codes, you can find him singing at the Campion College chant choir.

www.PacktPub.com
Support files, eBooks, discount offers and more

You might want to visit www.PacktPub.com for support files and downloads related to your book.

Did you know that Packt offers eBook versions of every book published, with PDF and ePub files available? You can upgrade to the eBook version at > for more details.

At www.PacktPub.com, you can also read a collection of free technical articles, sign up for a range of free newsletters and receive exclusive discounts and offers on Packt books and eBooks.

httpPacktLibPacktPubcom Do you need instant solutions to your IT - photo 1

http://PacktLib.PacktPub.com

Do you need instant solutions to your IT questions? PacktLib is Packt's online digital book library. Here, you can access, read and search across Packt's entire library of books.

Why Subscribe?
  • Fully searchable across every book published by Packt
  • Copy and paste, print and bookmark content
  • On demand and accessible via web browser
Free Access for Packt account holders

If you have an account with Packt at www.PacktPub.com, you can use this to access PacktLib today and view nine entirely free books. Simply use your login credentials for immediate access.

Next page
Light

Font size:

Reset

Interval:

Bookmark:

Make

Similar books «Python Data Visualization Cookbook»

Look at similar books to Python Data Visualization Cookbook. We have selected literature similar in name and meaning in the hope of providing readers with more options to find new, interesting, not yet read works.


Reviews about «Python Data Visualization Cookbook»

Discussion, reviews of the book Python Data Visualization Cookbook and just readers' own opinions. Leave your comments, write what you think about the work, its meaning or the main characters. Specify what exactly you liked and what you didn't like, and why you think so.