Kyran Dale - Data Visualization with Python and JavaScript: Scrape, Clean, Explore & Transform Your Data
Here you can read online Kyran Dale - Data Visualization with Python and JavaScript: Scrape, Clean, Explore & Transform Your Data full text of the book (entire story) in english for free. Download pdf and epub, get meaning, cover and reviews about this ebook. year: 2016, publisher: O’Reilly Media, genre: Home and family. Description of the work, (preface) as well as reviews are available. Best literature library LitArk.com created for fans of good reading and offers a wide selection of genres:
Romance novel
Science fiction
Adventure
Detective
Science
History
Home and family
Prose
Art
Politics
Computer
Non-fiction
Religion
Business
Children
Humor
Choose a favorite category and find really read worthwhile books. Enjoy immersion in the world of imagination, feel the emotions of the characters or learn something new for yourself, make an fascinating discovery.

- Book:Data Visualization with Python and JavaScript: Scrape, Clean, Explore & Transform Your Data
- Author:
- Publisher:O’Reilly Media
- Genre:
- Year:2016
- Rating:5 / 5
- Favourites:Add to favourites
- Your mark:
Data Visualization with Python and JavaScript: Scrape, Clean, Explore & Transform Your Data: summary, description and annotation
We offer to read an annotation, description, summary or preface (depends on what the author of the book "Data Visualization with Python and JavaScript: Scrape, Clean, Explore & Transform Your Data" wrote himself). If you haven't found the necessary information about the book — write in the comments, we will try to find it.
Python and Javascript are the perfect complement for turning data into rich, interactive web visualizations, in a world that increasingly expects more than a pre-rendered, static image. Developers need to know how to turn raw, unprocessed data, often dirty or malformed, into dynamic, interactive web visualizations. Author Kyran Dale teaches you how to leverage the power of best-of-breed Python and Javascript libraries to do so, using engaging examples and stressing hard-earned best-practice.
Youll learn how to:
- Get data programmatically, using scraping tools or web APIs
- Clean and process data using Pythons heavyweight data-processing libraries
- Deliver data to a browser using a lightweight Python server (Flask)
- Receive data and use it to create a web visualization, using D3, Canvas, or WebGL
Kyran Dale: author's other books
Who wrote Data Visualization with Python and JavaScript: Scrape, Clean, Explore & Transform Your Data? Find out the surname, the name of the author of the book and a list of all author's works by series.


Data Visualization with Python and JavaScript: Scrape, Clean, Explore & Transform Your Data — read online for free the complete book (whole text) full work
Below is the text of the book, divided by pages. System saving the place of the last page read, allows you to conveniently read the book "Data Visualization with Python and JavaScript: Scrape, Clean, Explore & Transform Your Data" online for free, without having to search again every time where you left off. Put a bookmark, and you can go to the page where you finished reading at any time.
Font size:
Interval:
Bookmark:
by Kyran Dale
Copyright 2016 Kyran Dale. All rights reserved.
Printed in the United States of America.
Published by OReilly Media, Inc. , 1005 Gravenstein Highway North, Sebastopol, CA 95472.
OReilly books may be purchased for educational, business, or sales promotional use. Online editions are also available for most titles ( http://safaribooksonline.com ). For more information, contact our corporate/institutional sales department: 800-998-9938 or corporate@oreilly.com .
- Editors: Dawn Schanafelt and Meghan Blanchette
- Production Editor: FILL IN PRODUCTION EDITOR
- Copyeditor: FILL IN COPYEDITOR
- Proofreader: FILL IN PROOFREADER
- Indexer: FILL IN INDEXER
- Interior Designer: David Futato
- Cover Designer: Karen Montgomery
- Illustrator: Rebecca Demarest
- January -4712: First Edition
- 2016-02-22: First Early Release
- 2016-03-21: Second Early Release
See http://oreilly.com/catalog/errata.csp?isbn=9781491956434 for release details.
The OReilly logo is a registered trademark of OReilly Media, Inc. Data Visualization with Python and JavaScript, the cover image, and related trade dress are trademarks of OReilly Media, Inc.
While the publisher and the author(s) have used good faith efforts to ensure that the information and instructions contained in this work are accurate, the publisher and the author(s) disclaim all responsibility for errors or omissions, including without limitation responsibility for damages resulting from the use of or reliance on this work. Use of the information and instructions contained in this work is at your own risk. If any code samples or other technology this work contains or describes is subject to open source licenses or the intellectual property rights of others, it is your responsibility to ensure that your use thereof complies with such licenses and/or rights.
978-1-491-95643-4
[FILL IN]
This book aims to get you up to speed with what is, in my opinion, the most powerful data-visualisation stack going: Python and JavaScript. Youll learn enough of big libraries like Pandas and D3 to start crafting your own web data-visualisations and refining your own toolchain. Expertise will come with practice but this book presents a shallow learning curve to basic competence.
If youre reading this in Early Release form Id love to hear any feedback you have. Please post it to . Thanks a lot, Kyran.
Youll also find a working copy of the Nobel-visualisation the book literally and figuratively builds towards at http://kyrandale.com/static/pyjsdataviz/index.html.
The bulk of this book tells one of the innumerable tales of data-visualisation, one carefully selected to showcase some powerful Python and JavaScript libraries or tools which together form a toolchain. This toolchain gathers raw, unrefined data at its start and delivers a rich, engaging web-visualisation at its end. Like all tales of data-visualisation it is a tale of transformation, in this case transforming a basic Wikipedia list of Nobel prize-winners into an interactive visualisation, bringing the data to life and making exploration of the prizes history easy and fun.
A primary motivation for writing the book is the belief that, whatever data you have, whatever story you want to tell with it, the natural home for the visualizations you transform it into is the web. As a delivery platform it is orders of magnitude more powerful than what came before and this book aims to smooth the passage from desktop or server-based data analysis and processing to getting the fruits of that labour out on the web.
But the most ambitious aim of this book is to persuade you that working with these two powerful languages towards the goal of delivering powerful web-visualisations is actually fun and engaging.
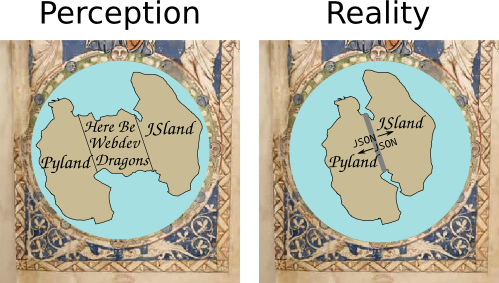
I think many potential data-viz programmers assume there is a big divide, called Web Development, between doing what they would like to do, which is program in Python and JavaScript. Web-dev involves loads of arcane knowledge about markup-languages, style-scripts, administration etc. and cant be done without tools with strange names like Gulp or Yeoman. I aim to show that these days that big divide can be collapsed to a thin and very permeable membrane, allowing you to focus on what you do well, programming stuff (see ) with minimal effort, relegating the web-servers to data-delivery.
First off, this book is for anyone with a reasonable grasp of Python or JavaScript who wants to explore one of the most exciting areas in the data-processing ecosystem right now, the exploding field of data-visualisation for the web. Its also about addressing some specific pain-points which in my experience are quite common.
When you get commissioned to write a technical book, chances are your editor will sensibly caution you to think in terms of pain points that your book aims to address. The two key pain points of this book are best illustrated by way of a couple of stories, one my own, the other one that has been told to me in various guises by JavaScripters I know.
Many years ago, as an academic researcher, I came across Python and fell in love. I had been writing some fairly complex simulations in C(++) and Pythons simplicity and power was a breathe of fresh air from all the boilerplate, Makefiles, declarations and definitions and the like. Programming was fun, Python the perfect glue, playing nicely with my C(++) libraries (Python wasnt then and still isnt a speed demon) and doing, with consummate ease, all the stuff that in low level languages is such a pain, e.g. file I/O, database access, serialisation etc.. I started to write all my graphical user interfaces (GUIs) and visualisations in Python, using wxPython, PyQt and a whole load of other refreshingly easy toolsets. Now theres some stuff there that I think is pretty cool but I doubt Ill ever get around to the necessary packaging, version checking and various other hurdles to distribution, so no-one else will ever see it.
At the time there existed what in theory was the perfect universal distribution system for the software Id so lovingly crafted, namely the web-browser. Available on pretty much every computer on earth, with its own built-in, interpreted programming language, write once, run everywhere. But everyone knew that a. Python doesnt play in the web-browsers sandpit and b. browsers were incapable of ambitious graphics and visualisations, being pretty much limited to static images and the odd jQuery transformation. JavaScript was a toy language tied to a very slow interpreter good for little DOM tricks but certainly nothing approaching what I could do on the desktop with Python. So that route was discounted, out of hand. My visualisations wanted to be on the web but there was no route through.
Fast forward a decade or so and, thanks to an arms race initiated by Google and their V8 engine, JavaScript is now orders of magnitude faster, in fact its now an awful lot faster than Python. HTML has also tidied up its act a bit, in the guise of HTML5. Its a lot nicer to work with, with much less boilerplate. What were loosely followed and distinctly shaky protocols like Scalable Vector Graphics (SVG) have firmed up nicely thanks to powerful visualisation libraries, D3 being preeminent. Modern browsers are obliged to work nicely with SVG and, increasingly, 3D in the form of
Font size:
Interval:
Bookmark:
Similar books «Data Visualization with Python and JavaScript: Scrape, Clean, Explore & Transform Your Data»
Look at similar books to Data Visualization with Python and JavaScript: Scrape, Clean, Explore & Transform Your Data. We have selected literature similar in name and meaning in the hope of providing readers with more options to find new, interesting, not yet read works.
Discussion, reviews of the book Data Visualization with Python and JavaScript: Scrape, Clean, Explore & Transform Your Data and just readers' own opinions. Leave your comments, write what you think about the work, its meaning or the main characters. Specify what exactly you liked and what you didn't like, and why you think so.