• Complain

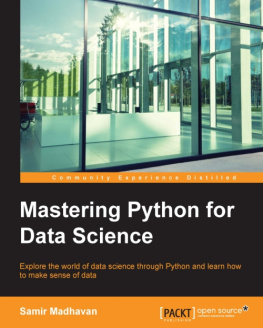
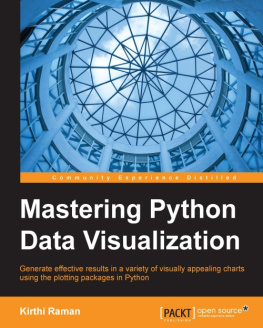
Kirthi Raman - Mastering Python Data Visualization

Here you can read online Kirthi Raman - Mastering Python Data Visualization full text of the book (entire story) in english for free. Download pdf and epub, get meaning, cover and reviews about this ebook. year: 2015, publisher: Packt Publishing, genre: Home and family. Description of the work, (preface) as well as reviews are available. Best literature library LitArk.com created for fans of good reading and offers a wide selection of genres:

Romance novel Science fiction Adventure Detective Science History Home and family Prose Art Politics Computer Non-fiction Religion Business Children Humor

Choose a favorite category and find really read worthwhile books. Enjoy immersion in the world of imagination, feel the emotions of the characters or learn something new for yourself, make an fascinating discovery.

Kirthi Raman Mastering Python Data Visualization
  • Book:
    Mastering Python Data Visualization
  • Author:
  • Publisher:
    Packt Publishing
  • Genre:
  • Year:
    2015
  • Rating:
    5 / 5
  • Favourites:
    Add to favourites
  • Your mark:
    • 100
    • 1
    • 2
    • 3
    • 4
    • 5

Mastering Python Data Visualization: summary, description and annotation

We offer to read an annotation, description, summary or preface (depends on what the author of the book "Mastering Python Data Visualization" wrote himself). If you haven't found the necessary information about the book — write in the comments, we will try to find it.

About This Book Explore various tools and their strengths while building meaningful representations that can make it easier to understand data Packed with computational methods and algorithms in diverse fields of science Written in an easy-to-follow categorical style, this book discusses some niche techniques that will make your code easier to work with and reuse Who This Book Is For If you are a Python developer who performs data visualization and wants to develop your existing Python knowledge, then this book is for you. A basic knowledge level and understanding of Python libraries is assumed. What You Will Learn Gather, cleanse, access, and map data to a visual framework Recognize which visualization method is applicable and learn best practices for data visualization Get acquainted with reader-driven narratives, author-driven narratives, and the principles of perception Understand why Python is an effective tool for numerical computation much like MATLAB, and explore some interesting data structures that come with it Use various visualization techniques to explore how Python can be very useful for financial and statistical computations Compare Python with other visualization approaches using Julia and a JavaScript-based framework such as D3.js Discover how Python can be used in conjunction with NoSQL, such as Hive, to produce results efficiently in a distributed environment In Detail Python has a handful of open source libraries for numerical computations that involve optimization, linear algebra, integration, interpolation, and other special functions using array objects, machine learning, data mining, and plotting. This book offers practical guidance to help you on the journey to effective data visualization. Commencing with a chapter on the data framework, the book covers the complete visualization process, using the most popular Python libraries with working examples. You will learn how to use NumPy, SciPy

Kirthi Raman: author's other books


Who wrote Mastering Python Data Visualization? Find out the surname, the name of the author of the book and a list of all author's works by series.

Mastering Python Data Visualization — read online for free the complete book (whole text) full work

Below is the text of the book, divided by pages. System saving the place of the last page read, allows you to conveniently read the book "Mastering Python Data Visualization" online for free, without having to search again every time where you left off. Put a bookmark, and you can go to the page where you finished reading at any time.

Light

Font size:

Reset

Interval:

Bookmark:

Make
Mastering Python Data Visualization

Mastering Python Data Visualization

Copyright 2015 Packt Publishing

All rights reserved. No part of this book may be reproduced, stored in a retrieval system, or transmitted in any form or by any means, without the prior written permission of the publisher, except in the case of brief quotations embedded in critical articles or reviews.

Every effort has been made in the preparation of this book to ensure the accuracy of the information presented. However, the information contained in this book is sold without warranty, either express or implied. Neither the author, nor Packt Publishing, and its dealers and distributors will be held liable for any damages caused or alleged to be caused directly or indirectly by this book.

Packt Publishing has endeavored to provide trademark information about all of the companies and products mentioned in this book by the appropriate use of capitals. However, Packt Publishing cannot guarantee the accuracy of this information.

First published: October 2015

Production reference: 1211015

Published by Packt Publishing Ltd.

Livery Place

35 Livery Street

Birmingham B3 2PB, UK.

ISBN 978-1-78398-832-7

www.packtpub.com

Credits

Author

Kirthi Raman

Reviewers

Julian Quick

Hang (Harvey) Yu

Acquisition Editor

Subho Gupta

Content Development Editor

Riddhi Tuljapurkar

Technical Editor

Humera Shaikh

Copy Editors

Relin Hedly

Sonia Mathur

Project Coordinator

Kinjal Bari

Proofreader

Safis Editing

Indexer

Monica Ajmera Mehta

Graphics

Abhinash Sahu

Jason Monteiro

Production Coordinator

Nilesh Mohite

Cover Work

Nilesh Mohite

About the Author

Kirthi Raman is currently working as a lead data engineer with Neustar Inc, based in Mclean, Virginia USA. Kirthi has worked on data visualization, with a focus on JavaScript, Python, R, and Java, and is a distinguished engineer. Previously, he worked as a principle architect, data analyst, and information retrieval specialist at Quotient, Inc. Kirthi has also worked as a technical lead and manager for a start-up.

He has taught discrete mathematics and computer science for several years. Kirthi has a graduate degree in mathematics and computer science from IIT Delhi and an MS in computer science from the University of Maryland. He has written several white papers on data analysis and big data.

I would like to thank my wife, Radhika, my son, Sid, and daughter, Niya, for putting up with my schedule even when I was on vacation. I would also like to thank my dad, Venkatraman, and my sisters, Vijaya and Meena, for their blessings.

About the Reviewers

Julian Quick is pursuing his bachelor's of science degree in environmental resources engineering at Humboldt State University with a specialization in energy resources and energy data analysis. He wrote Python code for the Earth Observing Laboratory, Canary Instruments, home energy monitoring, and the National Wind Technology Center.

I place on record my gratitude towards my family.

Hang (Harvey) Yu graduated from the University of Illinois at Urbana-Champaign with a PhD in computational biophysics and a master's in statistics. He has extensive experience in data mining, machine learning, and statistics. In the past, Harvey has worked on areas such as stochastic simulations and time series in C and Python as part of his academics. He was intrigued by algorithms and mathematical modeling and has been involved in data analytics since then.

Hang (Harvey) Yu is currently working as a data scientist in Silicon Valley. He is passionate about data science and has developed statistical/mathematical models based on techniques such as optimization and predictive modeling in R. Previously, Harvey has also worked as a computational science intern at ExxonMobil.

When Harvey is not coding, he plays soccer, reads fiction books, or listens to classical music. You can reach him at <.

www.PacktPub.com
Support files, eBooks, discount offers, and more

For support files and downloads related to your book, please visit www.PacktPub.com.

Did you know that Packt offers eBook versions of every book published, with PDF and ePub files available? You can upgrade to the eBook version at > for more details.

At www.PacktPub.com, you can also read a collection of free technical articles, sign up for a range of free newsletters and receive exclusive discounts and offers on Packt books and eBooks.

httpswww2packtpubcombookssubscriptionpacktlib Do you need instant - photo 1

https://www2.packtpub.com/books/subscription/packtlib

Do you need instant solutions to your IT questions? PacktLib is Packt's online digital book library. Here, you can search, access, and read Packt's entire library of books.

Why subscribe?
  • Fully searchable across every book published by Packt
  • Copy and paste, print, and bookmark content
  • On demand and accessible via a web browser
Free access for Packt account holders

If you have an account with Packt at www.PacktPub.com, you can use this to access PacktLib today and view 9 entirely free books. Simply use your login credentials for immediate access.

Preface

Data visualization is intended to provide information clearly and help the viewer understand them qualitatively. The well-known expression that a picture is worth a thousand words may be rephrased as "a picture tells a story as well as a large collection of words". Visualization is, therefore, a very precious tool that helps the viewer understand a concept quickly. However, data visualization is more of an art than a skill because if you try to overdo it, it could have a reverse effect.

We are currently faced with a plethora of data containing many insights that hold the key to success in the modern day. It is important to find the data, clean it, and use the right tool to visualize it. This book explains several different ways to visualize data using Python packages, along with very useful examples in many different areas such as numerical computing, financial models, statistical and machine learning, and genetics and networks.

This book presents an example code developed on Mac OS X 10.10.5 using Python 2.7, IPython 0.13.2, matplotlib 1.4.3, NumPy 1.9.2, SciPy 0.16.0, and conda build version 1.14.1.

What this book covers

, A Conceptual Framework for Data Visualization , expounds that data visualization should actually be referred to as "the visualization of information for knowledge inference". This chapter covers the framework, explaining the transition from data/information to knowledge and how meaningful representations (through logarithms, colormaps, scatterplots, correlations, and others) can make knowledge much easier to grasp.

, Data Analysis and Visualization , explains the importance of visualization and shows several steps in the visualization process, including several options of tools to choose from. Visualization methods have existed for a long time, and we are exposed to them very early; for instance, even young children can interpret bar charts. Interactive visualization has many strengths, and this chapter explains them with examples.

Next page
Light

Font size:

Reset

Interval:

Bookmark:

Make

Similar books «Mastering Python Data Visualization»

Look at similar books to Mastering Python Data Visualization. We have selected literature similar in name and meaning in the hope of providing readers with more options to find new, interesting, not yet read works.


Reviews about «Mastering Python Data Visualization»

Discussion, reviews of the book Mastering Python Data Visualization and just readers' own opinions. Leave your comments, write what you think about the work, its meaning or the main characters. Specify what exactly you liked and what you didn't like, and why you think so.