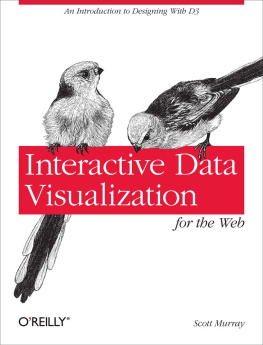
Interactive Data Visualization for the Web
Scott Murray
Beijing Cambridge Farnham Kln Sebastopol Tokyo
Download from Wow! eBook
Special Upgrade Offer
If you purchased this ebook directly from oreilly.com, you have the following benefits:
DRM-free ebooksuse your ebooks across devices without restrictions or limitations
Multiple formatsuse on your laptop, tablet, or phone
Lifetime access, with free updates
Dropbox syncingyour files, anywhere
If you purchased this ebook from another retailer, you can upgrade your ebook to take advantage of all these benefits for just $4.99. to access your ebook upgrade.
Please note that upgrade offers are not available from sample content.
A Note Regarding Supplemental Files
Supplemental files and examples for this book can be found at http://examples.oreilly.com/0636920026938/. Please use a standard desktop web browser to access these files, as they may not be accessible from all ereader devices.
All code files or examples referenced in the book will be available online. For physical books that ship with an accompanying disc, whenever possible, weve posted all CD/DVD content. Note that while we provide as much of the media content as we are able via free download, we are sometimes limited by licensing restrictions. Please direct any questions or concerns to .
Preface
This is a book about programming data visualizations for nonprogrammers. If youre an artist or graphic designer with visual skills but no prior experience working with data or code, this book is for you. If youre a journalist or researcher with lots of data but no prior experience working with visuals or code, this book is for you, too.
This book will introduce you to D3, a JavaScript-based tool for loading data into a web page and generating visuals from that data. I assume that you have little or no programming experience. Or, perhaps you have programmed before, but D3 and data visualization are bringing you to JavaScript for the first time, and youve heard bad things about it. Well, JavaScript is a little weird, but its not as bad as youve heard, and everything is going to be all right. Please sit down and make yourself comfortable.
This book began as a series of tutorials posted on my website. At the time (January 2012), there wasnt much information on D3 available that was accessible to beginners. Very quickly, I was getting hundreds, then thousands of page views a dayevidence that interest in the field generally (and D3 specifically) was growing like gangbusters. If youve read the tutorials, portions of the book will feel familiar, but there is a lot of new material here, including many more examples, sneaky tips, and warnings of things to avoid. Also, the book contains 78 percent more bad jokes.
Data visualization is an interdisciplinary field, which is just one reason its impossible to document the breadth of skills needed in a single book. Fortunately, because the field is exploding in popularity, there are many new titles to choose from, each of which complements this one.
On design process:
- Designing Data Visualizations: Intentional Communication from Data to Display by Noah Iliinsky and Julie Steele. OReilly Media, 2011.
- Data Visualization: A Successful Design Process by Andy Kirk. Packt Publishing, 2012.
On visual design principles and techniques:
- The Functional Art: An Introduction to Information Graphics and Visualization by Alberto Cairo. New Riders, 2012.
- Information Dashboard Design: The Effective Visual Communication of Data by Stephen Few. OReilly Media, 2006.
On the practicalities of working with data:
- Bad Data Handbook: Mapping the World of Data Problems by Q. Ethan McCallum. OReilly Media, 2012.
- Data Analysis with Open Source Tools: A Hands-On Guide for Programmers and Data Scientists by Philipp K. Janert. OReilly Media, 2010.
- Python for Data Analysis: Agile Tools for Real World Data by Wes McKinney. OReilly Media, 2012.
Conventions Used in This Book
The following typographical conventions are used in this book:
Italic Indicates new terms, URLs, email addresses, filenames, and file extensions. Constant width Used for program listings, as well as within paragraphs to refer to program elements such as variable or function names, databases, data types, environment variables, statements, and keywords. Constant width bold Shows commands or other text that should be typed literally by the user. Constant width italic Shows text that should be replaced with user-supplied values or by values determined by context.
Tip
This icon signifies a tip, suggestion, or general note.
Warning
This icon indicates a warning or caution.
Using Code Examples
This book is here to help you get your job done. In general, if this book includes code examples, you may use the code in this book in your programs and documentation. You do not need to contact us for permission unless youre reproducing a significant portion of the code. For example, writing a program that uses several chunks of code from this book does not require permission. Selling or distributing a CD-ROM of examples from OReilly books does require permission. Answering a question by citing this book and quoting example code does not require permission. Incorporating a significant amount of example code from this book into your products documentation does require permission.
We appreciate, but do not require, attribution. An attribution usually includes the title, author, publisher, and ISBN. For example: Interactive Data Visualizationfor the Web by Scott Murray (OReilly). Copyright 2013 Scott Murray, 978-1-449-33973-9.
If you feel your use of code examples falls outside fair use or the permission given above, feel free to contact us at .
Safari Books Online
Note
Safari Books Online is an on-demand digital library that delivers expert content in both book and video form from the worlds leading authors in technology and business.
Technology professionals, software developers, web designers, and business and creative professionals use Safari Books Online as their primary resource for research, problem solving, learning, and certification training.
Safari Books Online offers a range of product mixes and pricing programs for organizations, government agencies, and individuals. Subscribers have access to thousands of books, training videos, and prepublication manuscripts in one fully searchable database from publishers like OReilly Media, Prentice Hall Professional, Addison-Wesley Professional, Microsoft Press, Sams, Que, Peachpit Press, Focal Press, Cisco Press, John Wiley & Sons, Syngress, Morgan Kaufmann, IBM Redbooks, Packt, Adobe Press, FT Press, Apress, Manning, New Riders, McGraw-Hill, Jones & Bartlett, Course Technology, and dozens more. For more information about Safari Books Online, please visit us online.
How to Contact Us
Please address comments and questions concerning this book to the publisher:
| OReilly Media, Inc. |
| 1005 Gravenstein Highway North |
| Sebastopol, CA 95472 |






![Scott Murray [Scott Murray] - Interactive Data Visualization for the Web, 2nd Edition](/uploads/posts/book/120518/thumbs/scott-murray-scott-murray-interactive-data.jpg)
