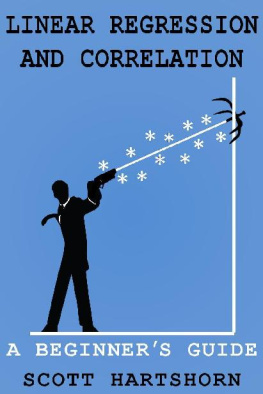
Scott Hartshorn [Hartshorn - Linear Regression And Correlation: A Beginner’s Guide
Here you can read online Scott Hartshorn [Hartshorn - Linear Regression And Correlation: A Beginner’s Guide full text of the book (entire story) in english for free. Download pdf and epub, get meaning, cover and reviews about this ebook. year: 2017, genre: Computer. Description of the work, (preface) as well as reviews are available. Best literature library LitArk.com created for fans of good reading and offers a wide selection of genres:
Romance novel
Science fiction
Adventure
Detective
Science
History
Home and family
Prose
Art
Politics
Computer
Non-fiction
Religion
Business
Children
Humor
Choose a favorite category and find really read worthwhile books. Enjoy immersion in the world of imagination, feel the emotions of the characters or learn something new for yourself, make an fascinating discovery.
- Book:Linear Regression And Correlation: A Beginner’s Guide
- Author:
- Genre:
- Year:2017
- Rating:3 / 5
- Favourites:Add to favourites
- Your mark:
- 60
- 1
- 2
- 3
- 4
- 5
Linear Regression And Correlation: A Beginner’s Guide: summary, description and annotation
We offer to read an annotation, description, summary or preface (depends on what the author of the book "Linear Regression And Correlation: A Beginner’s Guide" wrote himself). If you haven't found the necessary information about the book — write in the comments, we will try to find it.
Scott Hartshorn [Hartshorn: author's other books
Who wrote Linear Regression And Correlation: A Beginner’s Guide? Find out the surname, the name of the author of the book and a list of all author's works by series.
Linear Regression And Correlation: A Beginner’s Guide — read online for free the complete book (whole text) full work
Below is the text of the book, divided by pages. System saving the place of the last page read, allows you to conveniently read the book "Linear Regression And Correlation: A Beginner’s Guide" online for free, without having to search again every time where you left off. Put a bookmark, and you can go to the page where you finished reading at any time.
Font size:
Interval:
Bookmark:
A Beginners Guide
By Scott Hartshorn
What Is In This Book
Thank you for getting this book! This book contains examples of how to do linear regression in order to turn a scatter plot of data into a single equation. It is intended to be direct and to give easy to follow example problems that you can duplicate. In addition to information about simple linear regression, this book contains a worked example for these types of problems
- Multiple Linear Regression How to do regression with more than one variable
- Exponential Regression Regression where the data is increasing at a faster rate, such as Moores law predicts for computer chips
- R-Squared and Adjusted R-Squared A metric for determining how good your regression was
- Correlation A way of determining how much two sets of data change together, which has used in investments
Every example has been worked by hand showing the appropriate equations. There is no reliance on a software package to do the solutions, even for the more complicated parts such as multiple regression. This book shows how everything is done in a way you can duplicate. Additionally all the examples have all been solved using those equations in an Excel spreadsheet that you can download for free.
If you want to help us produce more material like this, then please leave a positive review for this book on Amazon . It really does make a difference!
If you spot any errors in this book, think of topics that we should include, or have any suggestions for future books then I would love to hear from you. Please email me at

~ Scott Hartshorn
Your Free Gift
As a way of saying thank you for your purchase, Im offering this free Linear Regression cheat sheet thats exclusive to my readers.
This cheat sheet contains all the equations required to do linear regression, with explanations of how they work. This is a PDF document that I encourage you to print, save, and share. You can download it by going here
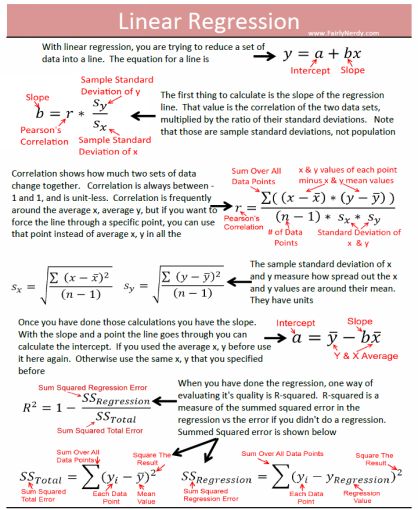
http://www.fairlynerdy.com/linear-regression-cheat-sheet/
Table of Contents
Section About R-Squared
Section About Correlation
Section About Linear Regression With 1 Independent Variable
Section About Exponential Regression
Section About Multiple Regression
This book covers linear regression. In doing so, this book covers several other necessary topics in order to understand linear regression. Those topics include correlation, as well as the most common regression metric, R .
Linear regression is a way of predicting an unknown variable using results that you do know. If you have a set of x and y values, you can use a regression equation to make a straight line relating the x and y. The reason you might want to do this is if you know some information, and want to estimate other information. For instance, you might have measured the fuel economy in your car when you were driving 30 miles per hour, when you were driving 40 miles per hour, and when you were driving 75 miles per hour. Now you are planning a cross country road trip and plan to average 60 miles per hour, and want to estimate what fuel economy you will have so that you can budget how much money you will need for gas.
The chart below shows an example of linear regression using real world data. It shows the relationship between the population of states within the United States, and the number of Starbucks (a coffee chain restaurant) within that state.
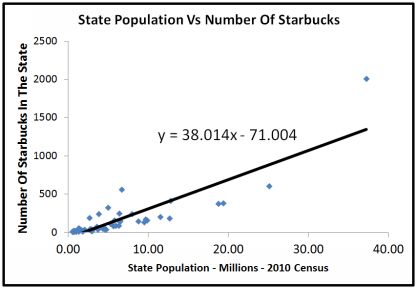
Likely this is information that is useful to no one. However, the result of the regression equation is that I can predict the number of Starbucks within a state by taking the population (in millions), multiplying it by 38.014, and subtracting 71.004. So if I had a state with 10 million people, I would predict it had (10 * 38.014 71.004 = 309.1) just over 309 Starbucks within the state.
This is a book on linear regression, which means the result of the regression will be a line when we have two variables, or a plane with 3 variables, or a hyperplane with more variables. The above chart was generated in Excel, which can do linear regression. This book shows how to do the regression analysis manually, and more importantly dives deeply into understanding exactly what is happening when the regression analysis is done.
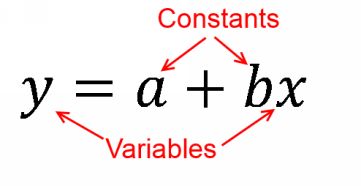
The final result of the regression process was the equation for a line. The equation for a line has this form
Multiple linear regression is linear regression when you have more than one independent variable. If you have a single independent variable, the regression equation forms a line. With two independent variables, it forms a plane. With more than two independent variables, the regression equation forms a hyperplane. The resulting equation for multiple regression is

One metric for measuring how good of a prediction was made is R . This metric measures how much error remains in your prediction after you did the regression vs. how much error you had if you did no regression.
Correlation is nearly the same as linear regression. Correlation is a measure of how much two variables change together. A high value of correlation (high magnitude) will result in a regression line that is a good prediction of the data. A low correlation value (near zero) will result in a poor linear regression line.
This book covers all of the above topics in detail. The order that they are covered in is
- R
- Correlation
- Linear Regression
- Multiple Linear Regression
The reason they are covered in that order, instead of skipping straight to linear regression, is that R builds up some information that is useful to know for correlation. And then correlation is 80% of what you need to know to understand simple linear regression.
Initially, it appears that multiple linear regression is a more challenging topic. However, as it turns out, you can solve multiple regression problems just by doing simple linear regression multiple times. This method for multiple regression isnt the best in terms of number of steps you need to take for very large problems, but the process of repeated simple linear regression is great for understanding how multiple regression works, and that is what is covered in this book.
There are a number of examples shown in this book. All of the examples were generated in Excel. If you want to get the data used in these examples, or if you want to see the equations themselves in action, you can download the Excel file with all the examples for free here http://www.fairlynerdy.com/linear-regression-examples/
Regression is a way of fitting a function to a set of data. For instance, maybe you have been using satellites to count the number of cars in the parking lot of Walmart stores for the past couple of years. You also know the quarterly sales that Walmart had during that time frame from their earnings report. You want to find a function that relates the two so that you can use your satellites to count the number of cars and predict Walmarts quarterly earnings. (In order to get an advantage in the stock market)
Font size:
Interval:
Bookmark:
Similar books «Linear Regression And Correlation: A Beginner’s Guide»
Look at similar books to Linear Regression And Correlation: A Beginner’s Guide. We have selected literature similar in name and meaning in the hope of providing readers with more options to find new, interesting, not yet read works.
Discussion, reviews of the book Linear Regression And Correlation: A Beginner’s Guide and just readers' own opinions. Leave your comments, write what you think about the work, its meaning or the main characters. Specify what exactly you liked and what you didn't like, and why you think so.

