• Complain

Scott Hartshorn - Hypothesis Testing: A Visual Introduction to Statistical Significance

Here you can read online Scott Hartshorn - Hypothesis Testing: A Visual Introduction to Statistical Significance full text of the book (entire story) in english for free. Download pdf and epub, get meaning, cover and reviews about this ebook. year: 2017, publisher: Independently Published, genre: Children. Description of the work, (preface) as well as reviews are available. Best literature library LitArk.com created for fans of good reading and offers a wide selection of genres:

Romance novel Science fiction Adventure Detective Science History Home and family Prose Art Politics Computer Non-fiction Religion Business Children Humor

Choose a favorite category and find really read worthwhile books. Enjoy immersion in the world of imagination, feel the emotions of the characters or learn something new for yourself, make an fascinating discovery.

No cover
  • Book:
    Hypothesis Testing: A Visual Introduction to Statistical Significance
  • Author:
  • Publisher:
    Independently Published
  • Genre:
  • Year:
    2017
  • Rating:
    3 / 5
  • Favourites:
    Add to favourites
  • Your mark:
    • 60
    • 1
    • 2
    • 3
    • 4
    • 5

Hypothesis Testing: A Visual Introduction to Statistical Significance: summary, description and annotation

We offer to read an annotation, description, summary or preface (depends on what the author of the book "Hypothesis Testing: A Visual Introduction to Statistical Significance" wrote himself). If you haven't found the necessary information about the book — write in the comments, we will try to find it.

If you are looking for a short beginners guide packed with visual examples, this booklet is for you.

Statistical significance is a way of determining if an outcome occurred by random chance, or did something cause that outcome to be different than the expected baseline. Statistical significance calculations find their way into scientific and engineering tests of all kinds, from medical tests with control group and a testing group, to the analysis of how strong a newly made batch of parts is. Those same calculations are also used in investment decisions.

This book goes through all the major types of statistical significance calculations, and works through an example using them, and explains when you would use that specific type instead of one of the others. Just as importantly, this book is loaded with visual examples of what exactly statistical significance is, and the book doesnt assume that you have prior in depth knowledge of statistics or that use regularly use an advanced statistics software package. If you know what an average is and can use Excel, this book will build the rest of the knowledge, and do so in an intuitive way. For instance did you know that

Statistical Significance Can Be Easily Understood By Rolling A Few Dice?

In fact, you probably already know this key concept in statistical significance, although you might not have made the connection. The concept is this. Roll a single die. Is any number more likely to come up than another ? No, they are all equally likely. Now roll 2 dice and take their sum. Suddenly the number 7 is the most likely sum (which is why casinos win on it in craps). The probability of the outcome of any single die didnt change, but the probability of the outcome of the average of all the dice rolled became more predictable. If you keep increasing the number of dice rolled, the outcome of the average gets more and more predictable. This is the exact same effect that is at the heart of all the statistical significance equations (and is explained in more detail in the book)

You Are Looking At Revision 2 Of This Book

The book that you are looking at on Amazon right now is the second revision of the book. Earlier I said that you might have missed the intuitive connections to statistical significance that you already knew. Well that is because I missed them in the first release of this book. The first release included examples for the major types of statistical significance

  • A Z-Test
  • A 1 Sample T-Test
  • A Paired T Test
  • A 2 Sample T-Test with equal variance
  • A 2 Sample T-test with unequal variance
  • Descriptions of how to use a T-table and a Z-table

And those examples were good for what they were, but were frankly not significantly different than you could find in many statistics textbooks or on Wikipedia. However this revision builds on those examples, draws connections between them, and most importantly explains concepts such as the normal curve or statistical significance in a way that will stick with you even if you dont remember the exact equation.

If you are a visual learner and like to learn by example, this intuitive booklet might be a good fit for you. Statistical Significance is fascinating topic and likely touches your life every single day. It is a very important tool that is used in data analysis throughout a wide-range of industries - so take an easy dive into the topic with this visual approach!

Scott Hartshorn: author's other books


Who wrote Hypothesis Testing: A Visual Introduction to Statistical Significance? Find out the surname, the name of the author of the book and a list of all author's works by series.

Hypothesis Testing: A Visual Introduction to Statistical Significance — read online for free the complete book (whole text) full work

Below is the text of the book, divided by pages. System saving the place of the last page read, allows you to conveniently read the book "Hypothesis Testing: A Visual Introduction to Statistical Significance" online for free, without having to search again every time where you left off. Put a bookmark, and you can go to the page where you finished reading at any time.

Light

Font size:

Reset

Interval:

Bookmark:

Make
Hypothesis Testing
A Visual Introduction To Statistical Significance
By Scott Hartshorn
What Is In This Book
Thank you for getting this book! This book contains examples of different types of hypothesis testing to determine if you have a statistically significant result. It is intended to be direct and to give easy to follow example problems that you can duplicate. In addition to information about what statistical significance is, or what the normal curve is exactly, the book contains a worked example for these types of statistical significance problems
  • Z Test
  • 1 Sample T Test
  • Paired T-Test ( 2 examples )
  • 2 Sample T-Test with Equal Variance
  • 2 Sample T-Test with Unequal Variance
Every example has been worked by hand showing the appropriate equations and also done in Excel using the Excel functions. So every example has 2 different ways to solve the problem. Additionally, this book includes a
  • Z Table
  • T Table
Along with the functions that you can use to create your own Z-Table or T-Table in Excel
If you want to help us produce more material like this, then please leave a positive review for this book on Amazon . It really does make a difference!
Your Free Gift
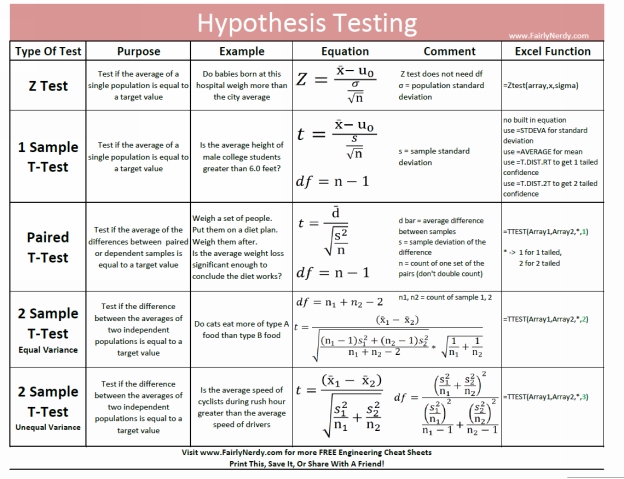
As a way of saying thank you for your purchase, Im offering this free Hypothesis Testing cheat sheet thats exclusive to my readers.
This cheat sheet contains information about the 5 main types of hypothesis tests, including an example of when you would use them, the equations that drive them, and the Excel functions for the equations. This is a PDF document that I encourage you to print, save, and share. You can download it by going here
httpwwwfairlynerdycomhypothesis-testing-cheat-sheets Table of Contents - photo 1
http://www.fairlynerdy.com/hypothesis-testing-cheat-sheets/
Table of Contents
  • (If you read nothing else, read this)
Statistical Significance Overview
When you are testing for statistical significance, the equation you are asking is, how unlikely would this outcome have been if it just happened by random chance?
For instance, say you are a farmer trying out a new type of pig food. You are trying to determine if the new food makes the pigs gain weight faster. To do this test, you try the new food on 10 pigs, and the old food on 10 pigs. After a month, you measure the weight of all the pigs and find that the pigs who ate the new food gained more weight. Does that mean the new food caused the increased weight gain?
Well, maybe. Maybe the new food caused that result, or maybe you just happened to give the new food to the 10 pigs that were always going to gain the most weight no matter what. How can you tell?
What we are doing with statistical significance calculations is determining how unlikely an outcome was to occur by random chance, and then deciding if that probability is unlikely enough that we can conclude something other than random chance caused that outcome.
The two most important things in a statistical significance calculation are the distance the average value of your measured data is from what you are comparing it against, and the standard deviation of what you are measuring. It is easy to understand how the difference in measurements is important. If I am making some measurements, and I measure a difference of 100 compared to the typical mean value, that is more likely to be significant than if I measured a difference of 5. The greater the difference in measurements, the greater the significance, assuming that all other values are equal.
Standard Deviation
Standard deviation is the second important topic in calculating statistical significance. It is worth going over how the standard deviation works. Standard deviation is a way of measuring how spread out your measured values are. If the values you are measuring are all clustered together, they will have a low standard deviation. If they have a lot of variation in the measurements, they will have a high standard deviation.
As an example, pick a coin from your pocket, for instance, a quarter if you are in the United States. If you measure the weight of 10 of those coins, they will probably all weigh about the same. After all, they were all manufactured to be similar. Now if you go outside and find 10 rocks approximately the size of those coins and measure the weight of those rocks, there will be a lot more variation in the weight of the rocks. The standard deviation of the weight of the rocks is higher than it is for the coins.
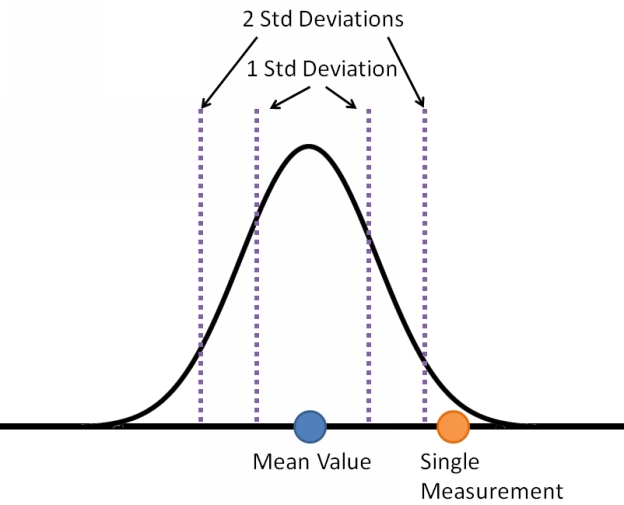
The image below shows what we typically think of when we think about standard deviation. There is a mean value at the center of a normal curve. If you make another measurement of the same type of data it will fall somewhere on that normal curve, with decreasing likelihood the farther you get away from the mean value.
With a typical normal curve 68 percent of the data will fall within 1 standard - photo 2
With a typical normal curve
  • 68 percent of the data will fall within 1 standard deviation of the mean
  • 95 percent of the data be within 2 standard deviations
  • 99.7 percent of the data is within 3 standard deviations
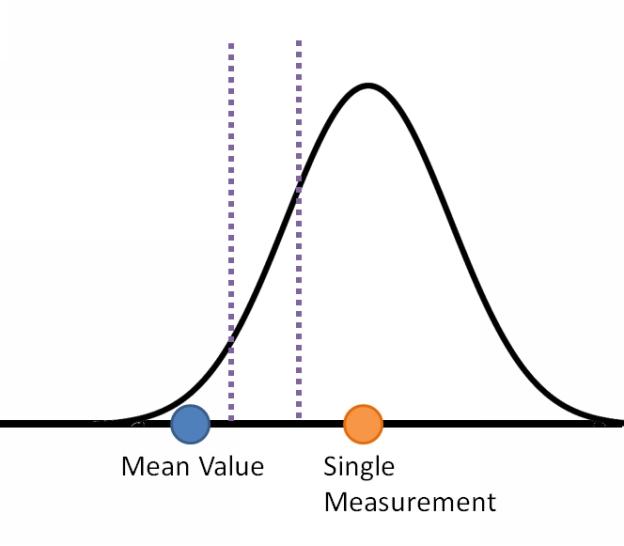
With hypothesis testing, what we are doing is turning that chart around and asking the question in reverse. Now what we are doing is putting a normal curve around our measured data, and asking the question How likely is it that this measured data comes from the same source as the reference data?" We are asking how many standard deviations the reference value is from our mean value. This is shown in the chart below.
Now this might seem like it was a useless distinction If the reference value - photo 3
Now this might seem like it was a useless distinction. If the reference value was two standard deviations away from the measured value, then the measured value will be two standard deviations away from the reference value. That is completely true, but only if we only have a single piece of measured data.
The Most Important Concept In This Book
We now get to the single most important concept in understanding statistical significance. If you understand this, then you understand statistical significance. The rest of it is just knowing when to apply which equation. Because of its importance, we will spend the next couple pages going over this concept a few difference ways.
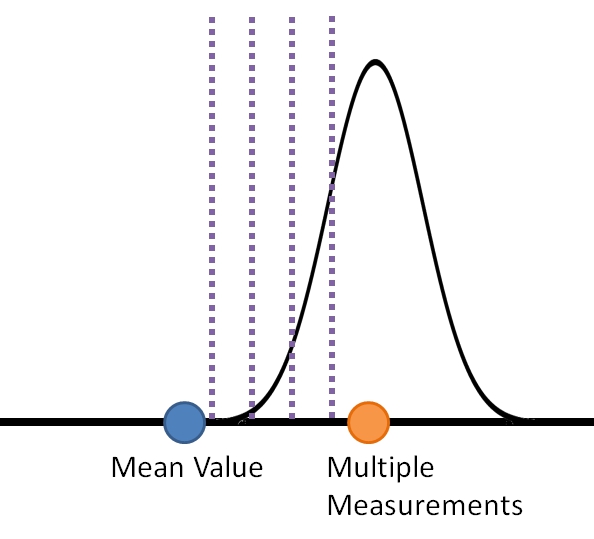
The concept is this: We do not care about the standard deviation of our data. What we care about is the standard deviation of the average value of all of our measurements. And that standard deviation of the average can change as you make additional measurements.
This is shown in the chart below. Like the chart above, it has a normal curve centered on the mean values of the measured data. However, due to the fact that there are more measurements in this data, rather than just the single measurement in the chart above, this normal curve is narrower
Since the normal curve is narrower the reference value falls farther away from - photo 4
Since the normal curve is narrower, the reference value falls farther away from the measured average, in terms of the number of standard deviations. As a result, we will conclude that it is less likely that our measured values and the reference value came from the same set of data.
Why Does The Standard Deviation Of The Mean Decrease With More Measurements?
Next page
Light

Font size:

Reset

Interval:

Bookmark:

Make

Similar books «Hypothesis Testing: A Visual Introduction to Statistical Significance»

Look at similar books to Hypothesis Testing: A Visual Introduction to Statistical Significance. We have selected literature similar in name and meaning in the hope of providing readers with more options to find new, interesting, not yet read works.


Reviews about «Hypothesis Testing: A Visual Introduction to Statistical Significance»

Discussion, reviews of the book Hypothesis Testing: A Visual Introduction to Statistical Significance and just readers' own opinions. Leave your comments, write what you think about the work, its meaning or the main characters. Specify what exactly you liked and what you didn't like, and why you think so.